
Solar Eclipse Decade Page
Solar Eclipses: 2011 - 2020
Fred Espenak
| Index |
| World Map of Central Solar Eclipses |
| Global Maps of Solar Eclipses |
| Global Map Animations of Solar Eclipses |
| Table of Solar Eclipses |
| Solar Eclipse Links |
| Eclipse Publications |
| Predictions Info |
Introduction
A concise summary of all solar eclipses from 2011 through 2020 is presented here in four ways. The first is a World Map showing the path of every central solar eclipse (total, annular, and hybrid). The second is a series of Global Maps showing the geographic regions of visibility for each eclipse. The third is a series of Global Map Animations showing the Moon's shadows sweeping across Earth for each eclipse. The forth is a Table listing the primary characteristics of each solar eclipse. Near the bottom of the page are a series of Links for more on solar eclipses.
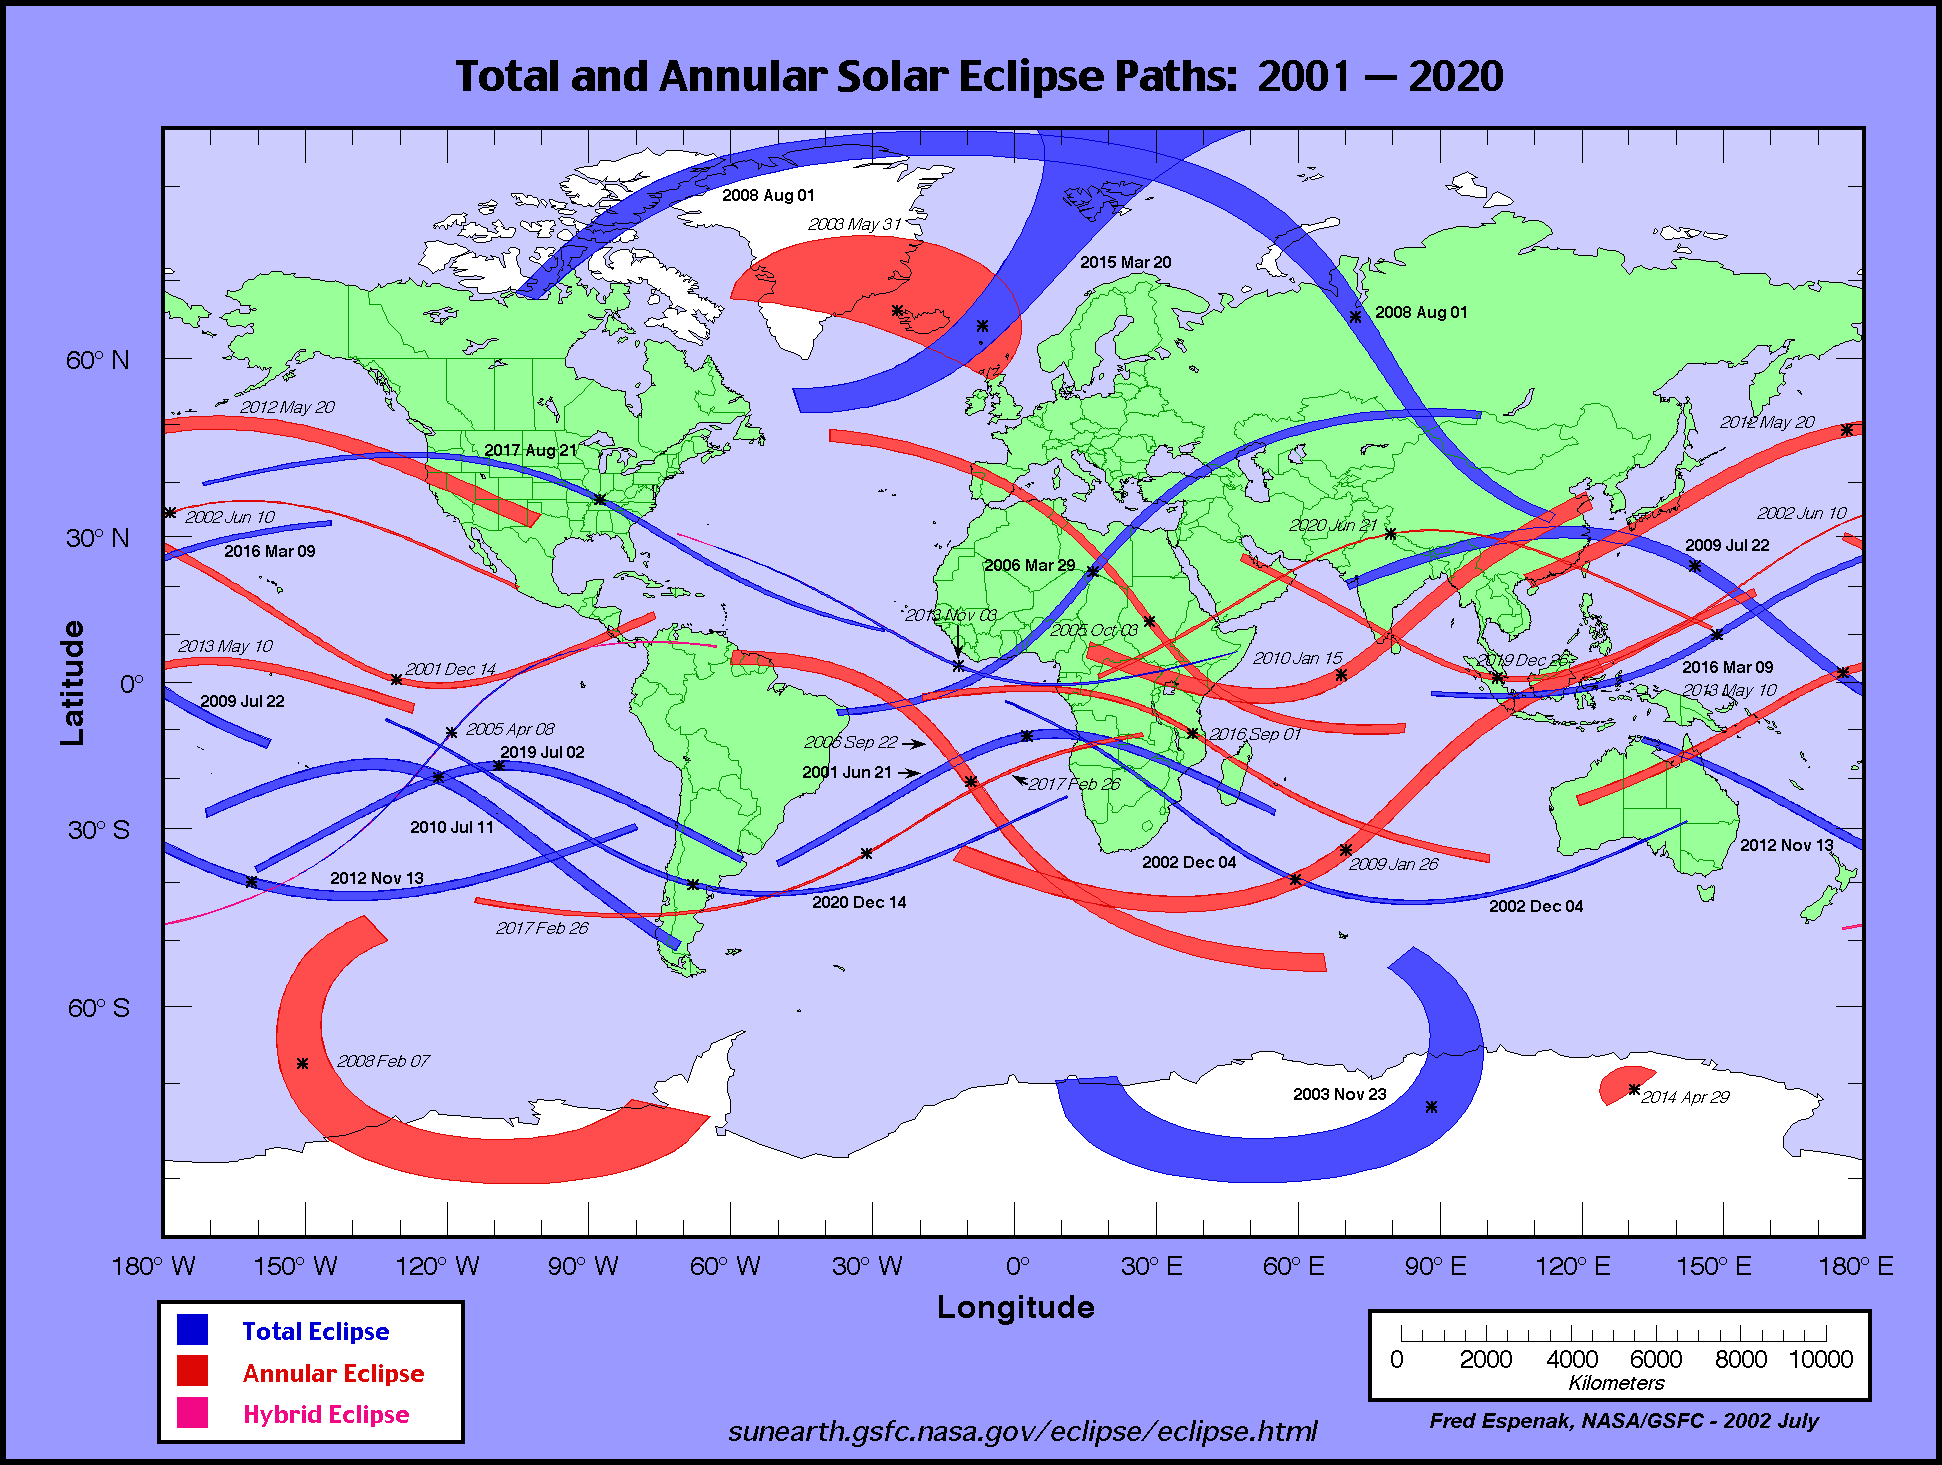
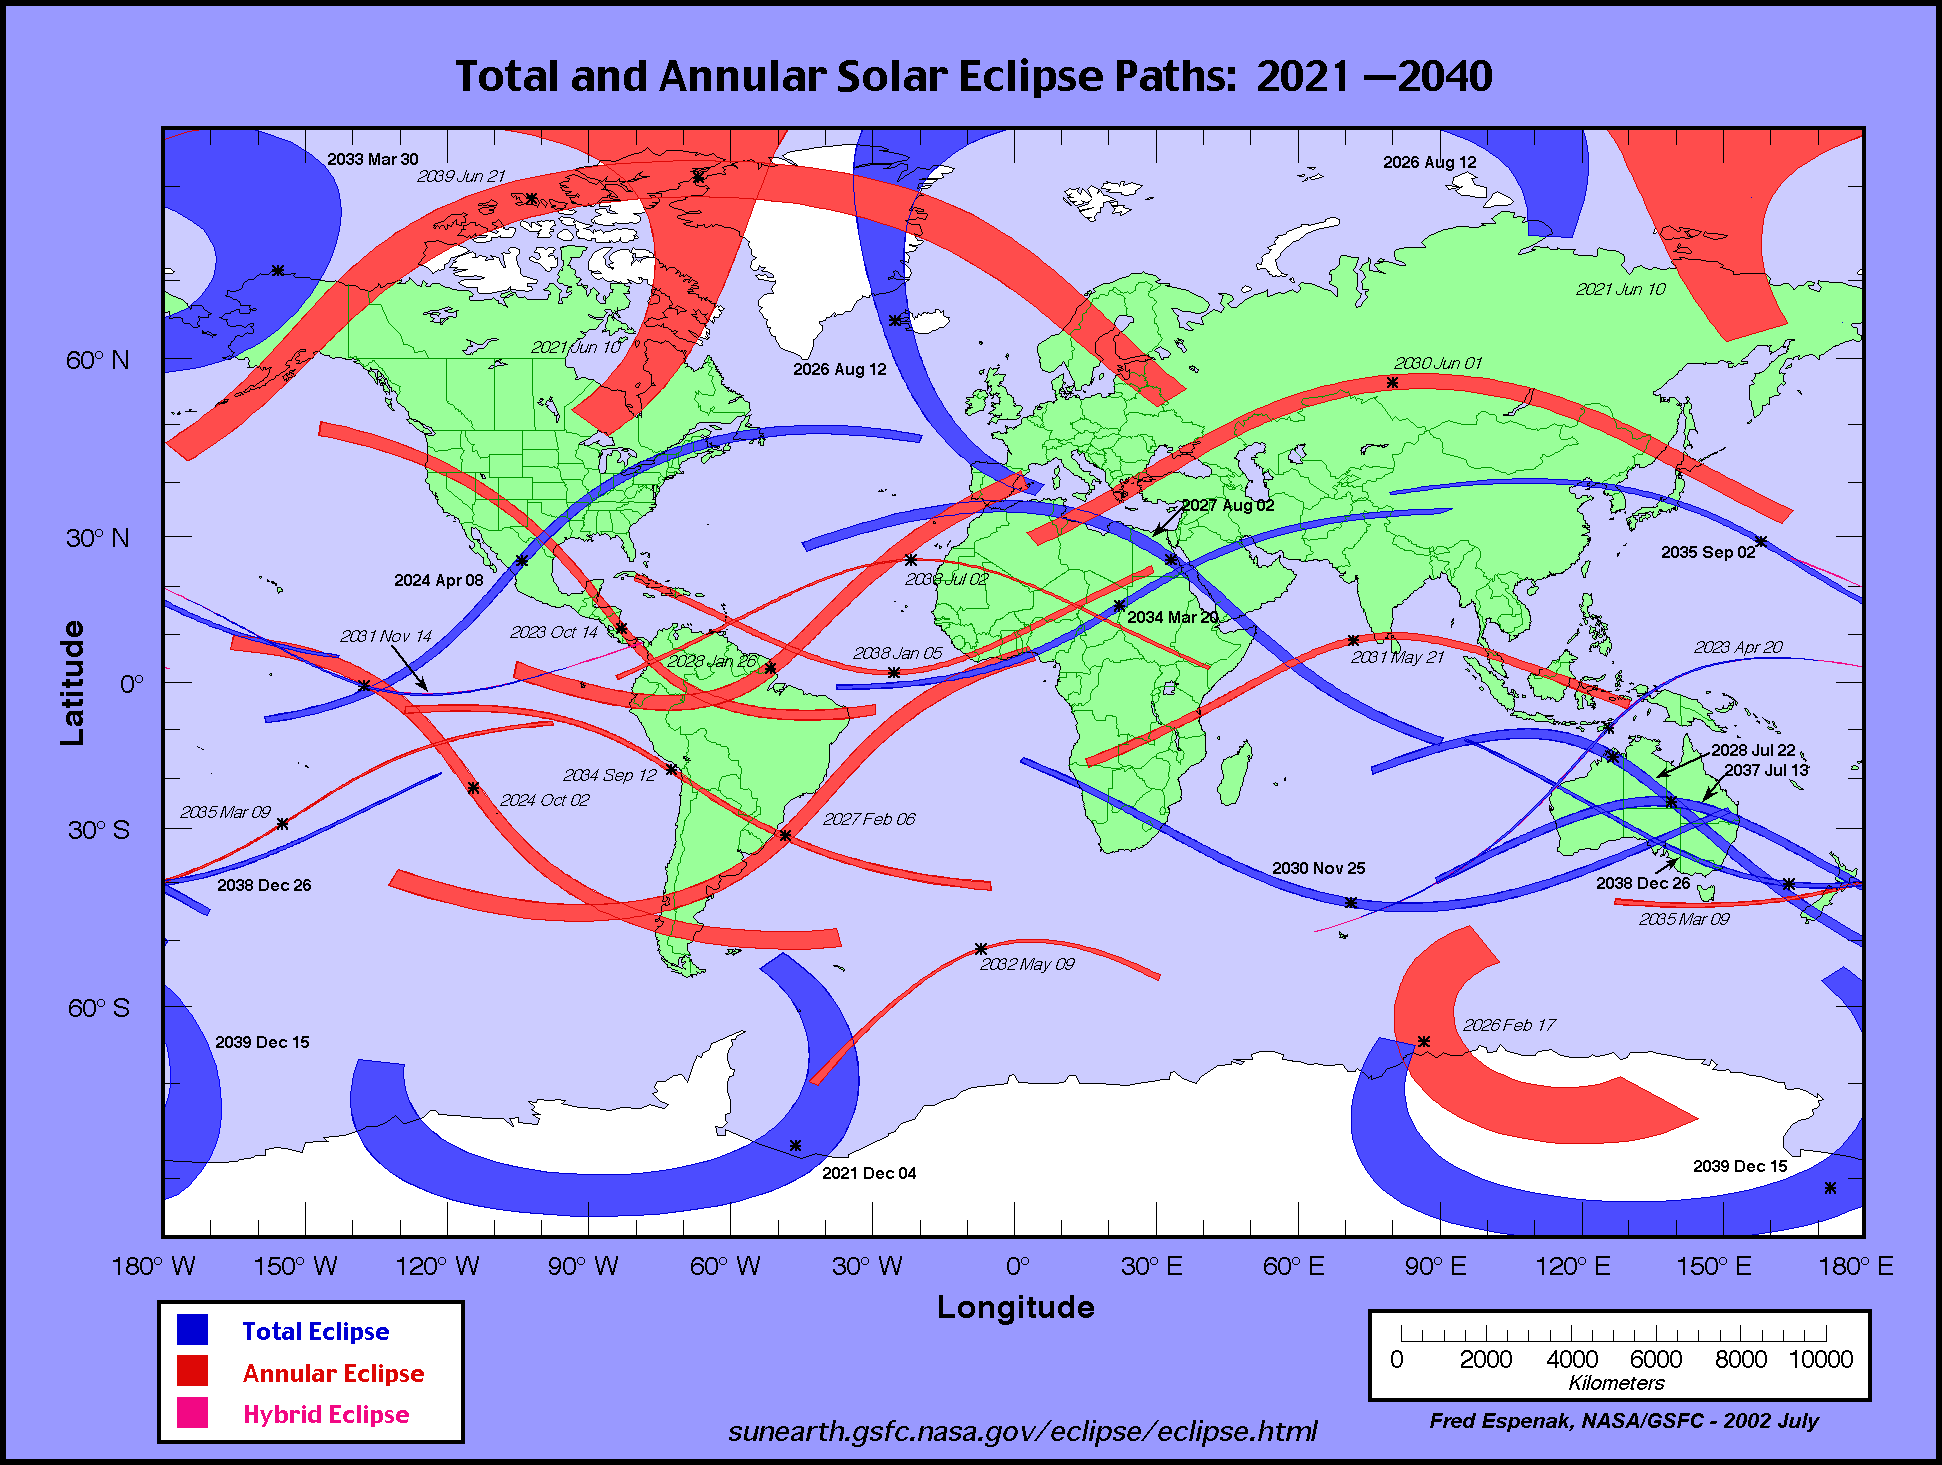
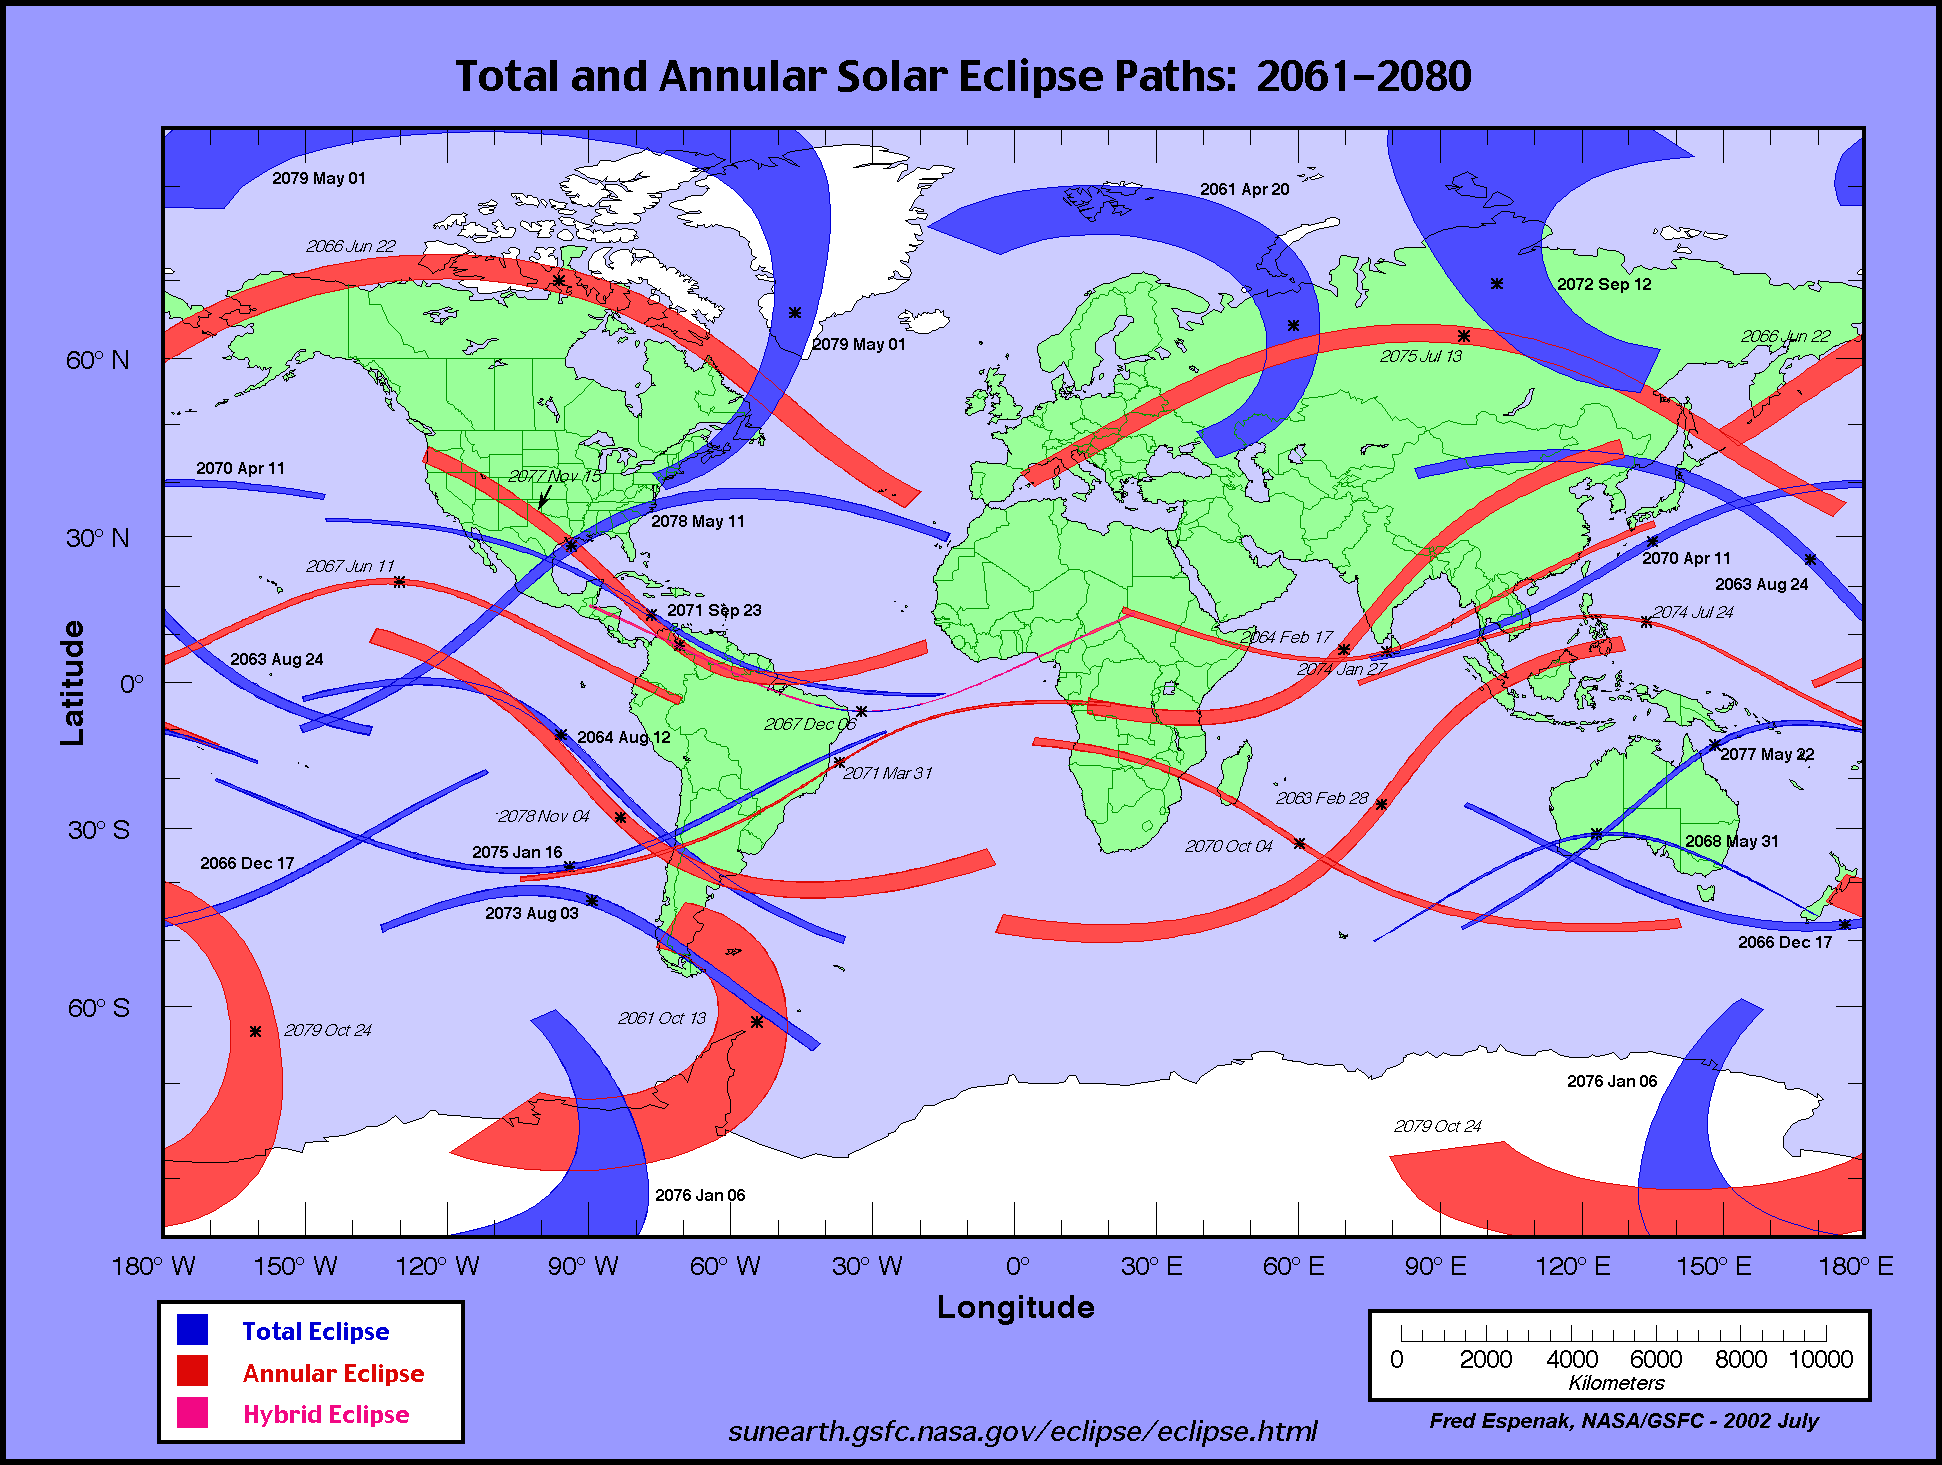
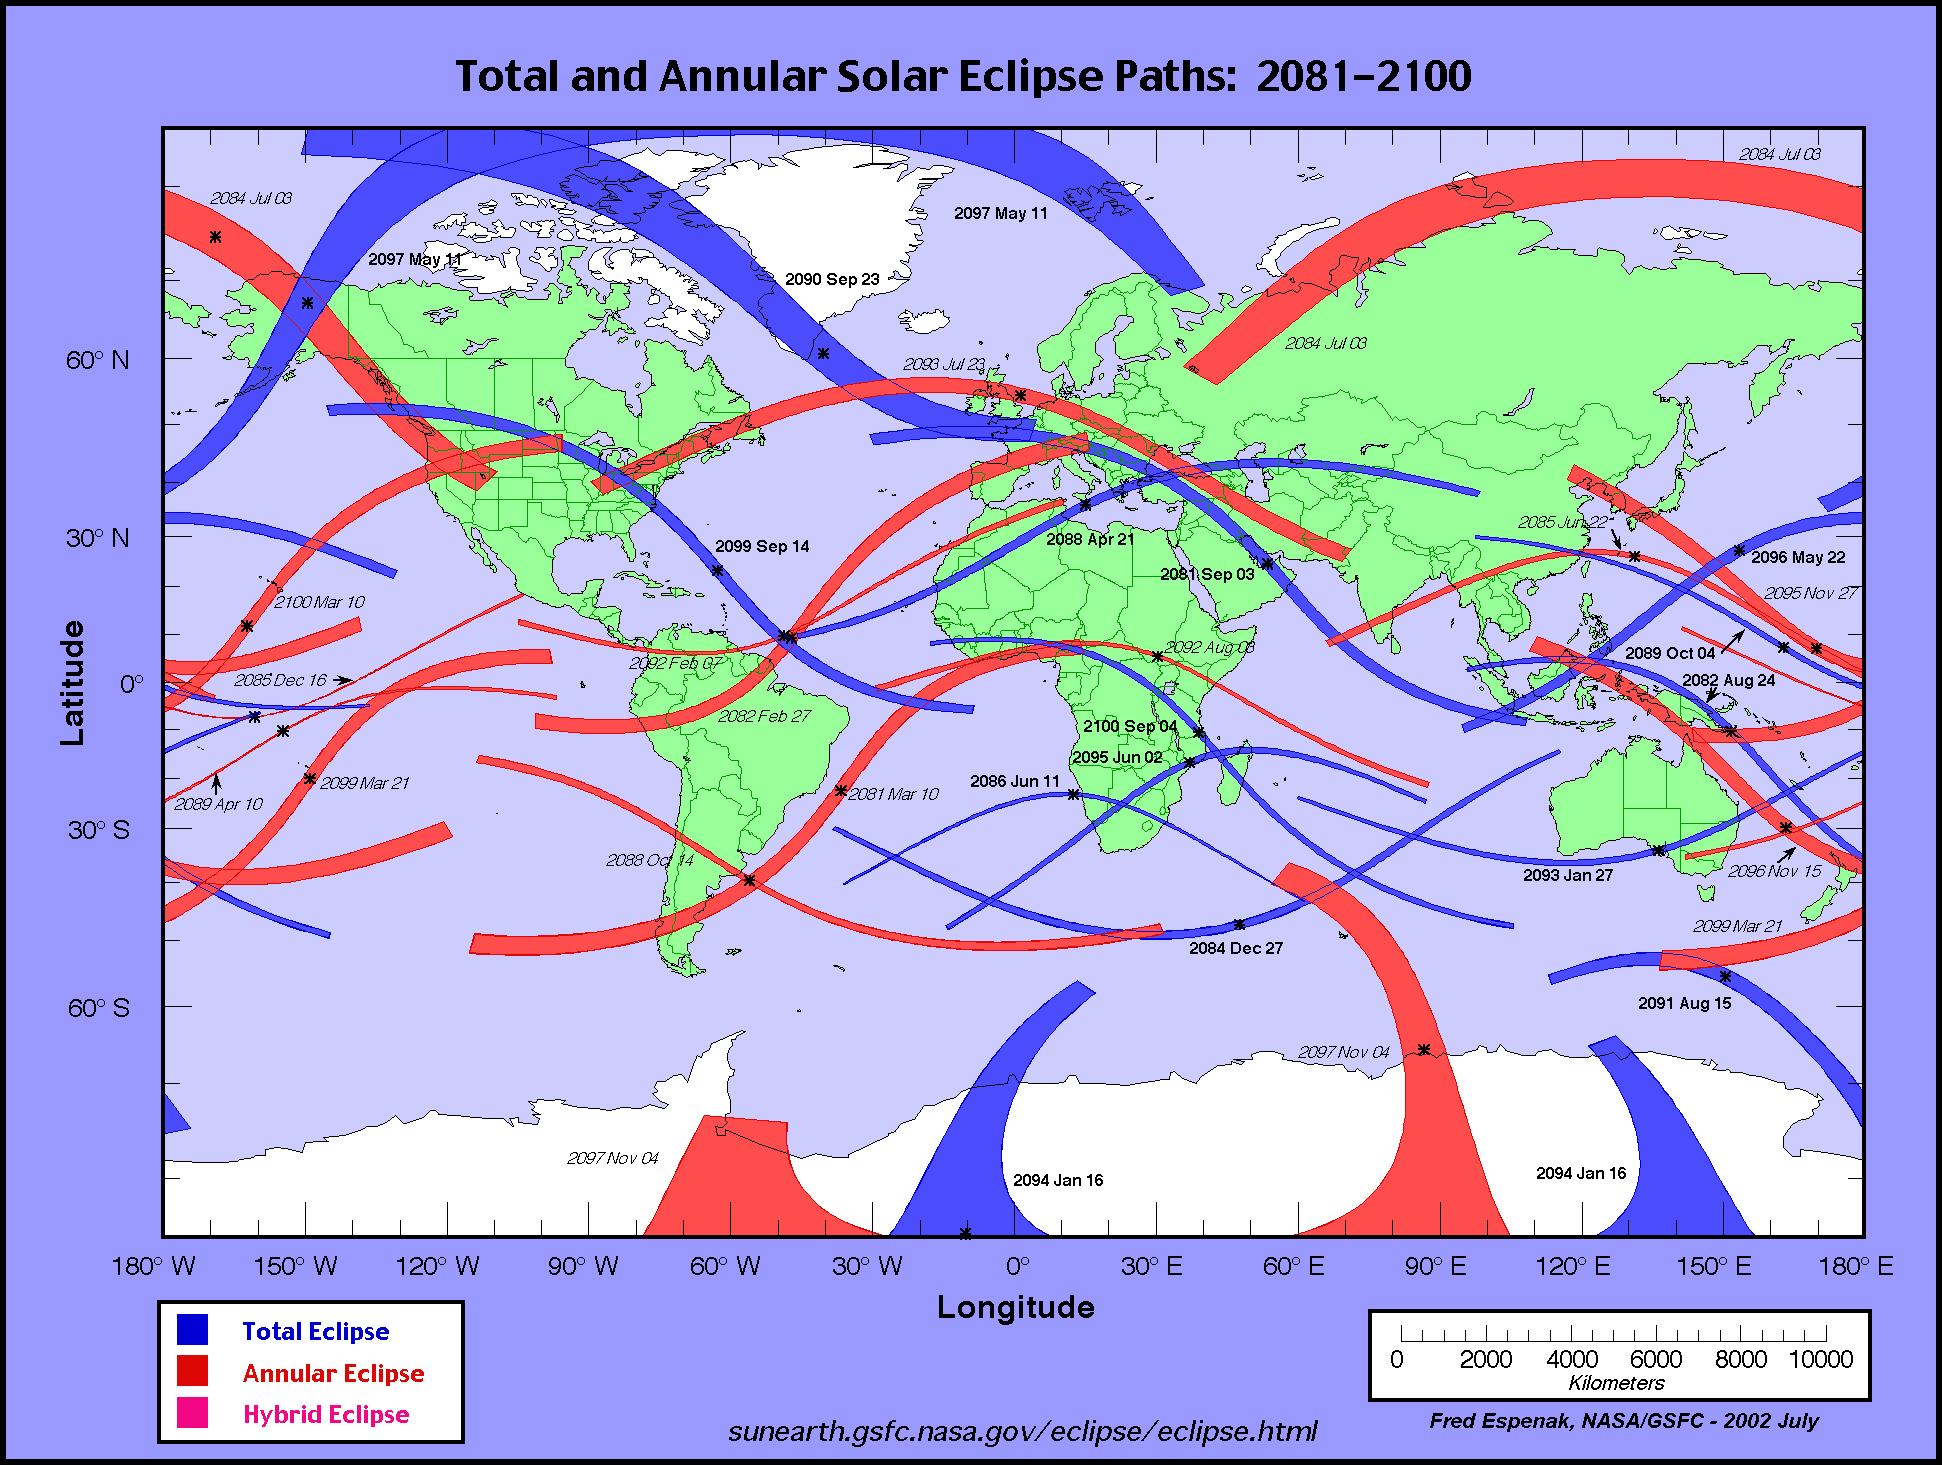
World Map of Central Solar Eclipses: 2011 through 2020
The path of every central solar eclipse (total, annular, and hybrid) from 2011 through 2020 is plotted on the world map (equidistant cylindrical projection). The central paths of total eclipses are shaded blue, while annular eclipses are shaded red. For hybrid eclipses, part of the path is shaded blue (total), and part is shaded red (annular). Major cities are plotted as black dots, scaled by population size.
Click HERE for a larger version of this map
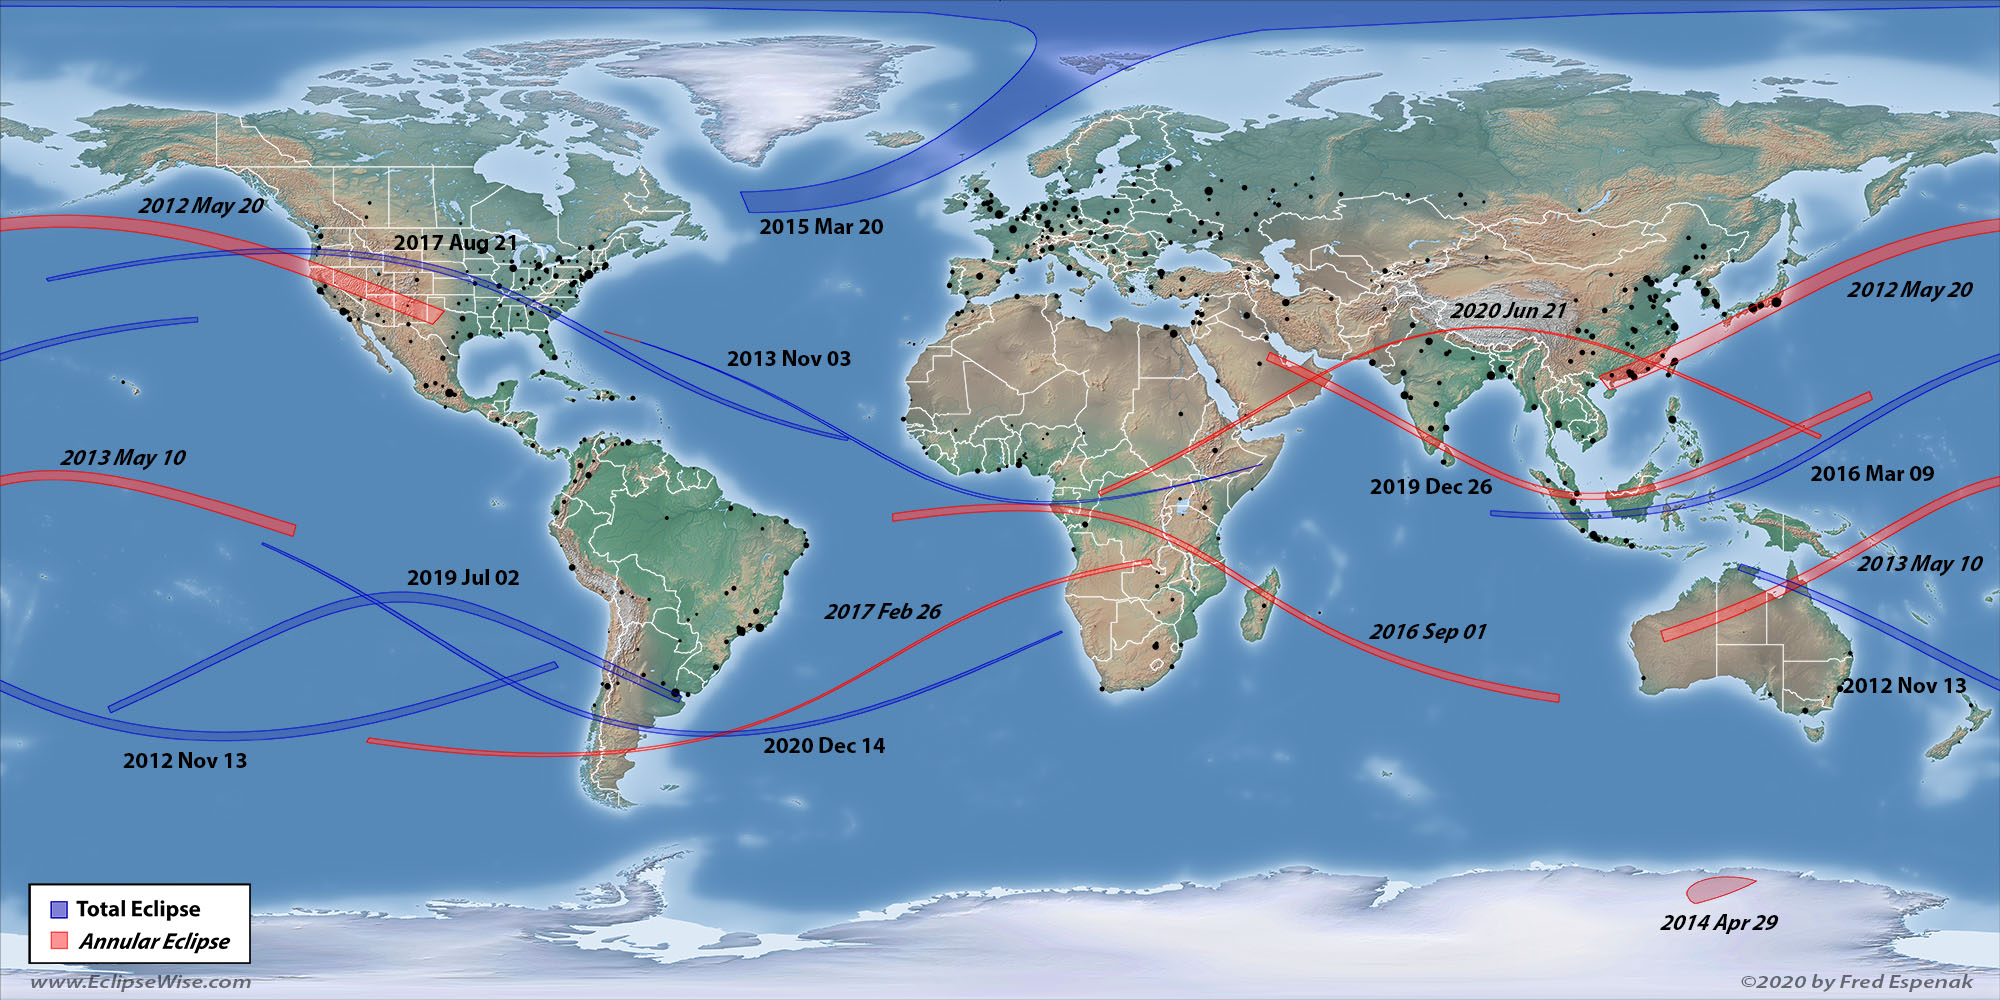
For a World Map of other decades, visit: 21st Century World Atlas of Central Solar Eclipses
Eclipse Guides


|
Global Maps of Solar Eclipses: 2011 - 2020
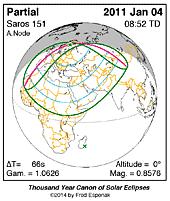
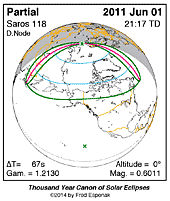
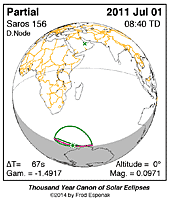
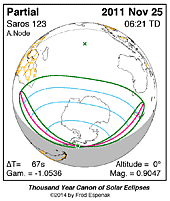
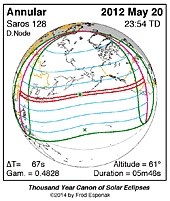
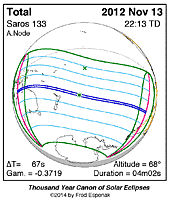
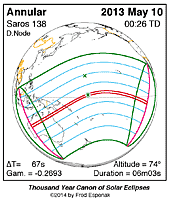
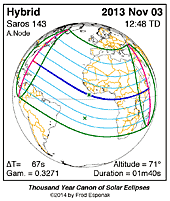
The maps below offer a concise summary of all solar eclipses from 2011 through 2020 . Each map depicts the geographic region of visibility for a single eclipse. For central eclipses, the total or annular path is plotted in either blue (total) or red (annular). Click on an eclipse map to link to the EclipseWise Prime Page with complete details about that eclipse, including a larger version of the map. Visit Key to Solar Eclipse Maps for a detailed explanation of these maps.
Below each map is the link Google Eclipse Map. Click on this to see the eclipse path plotted on an interactive Google Map.
Global Map Animations of Solar Eclipses: 2011 - 2020
Michael Zeiler GreatAmericanEclipse.com and Fred Espenak EclipseWise.com have created a series of eclipse animations - one for every solar eclipse during the 21st Century.
The animations show the path of the Moon's shadows as they sweep across a global map of Earth (an orthographic projection). The vantage point of the animations is as seen from the Moon. The daylight hemisphere of Earth then faces the Moon and the lunar shadows appear perfectly circular with no distorted projection effects as they race across Earth. Another consequence of this viewing geometry is that the Moon's shadows move across the disk of Earth in a straight line.
For all eclipses, the Moon's large, pale penumbral shadow appears as a lightly shaded circle and is outlined with a solid black edge. For Total, Annular, and Hybrid eclipses, the Moon's much smaller inner shadow (either umbra or antumbral) appears as a tiny black disk and tracks along the path of totality or annularity (yellow strip). A partial eclipse is visible from within the penumbra, while a total or annular eclipse is visible inside the umbra or antumbra.
Each animation includes important information in the four corners. In the upper left corner is the type of eclipse and the eclipse date. To the upper right is the Universal Time. The lower left corner displays the instantaneous duration of totality or annularity (not used for partial eclipses). To the lower right is the credit for the animation.
Animations are available in three sizes/resolutions: small (300 x 300 pixels), medium (400 x 400 pixels), and large (800 x 800 pixels). They can be viewed through the links below each thumbnail.

These animations may be freely distributed and used through Creative Commons.
You may use and distribute these eclipse animations as long as they are not modified and you include an attribution.
Solar Eclipse Global Animation by
Fred Espenak and Michael Zeiler
is licensed under a Creative Commons Attribution-NoDerivatives 4.0 International License.
Based on work at EclipseWise.com
and GreatAmericanEclipse.com
Suggested attribution: "Global Animation Map of Solar Eclipse courtesy of Michael Zeiler (GreatAmericanEclipse.com) and Fred Espenak (EclipseWise.com)".
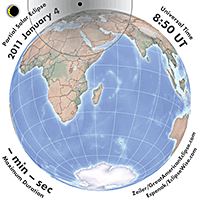
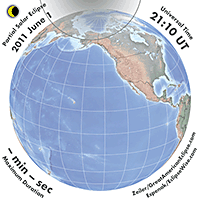
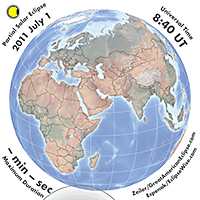
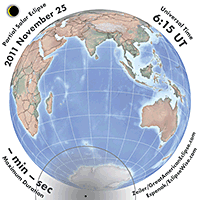
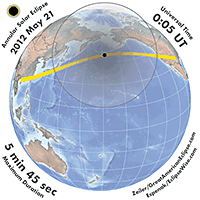
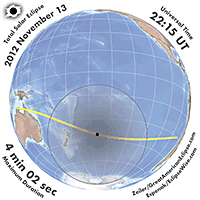
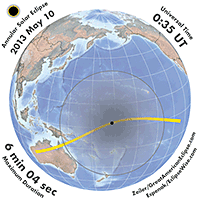
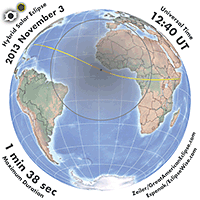
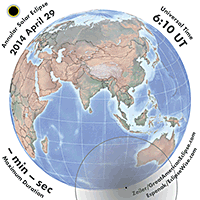
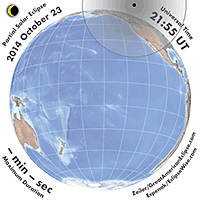
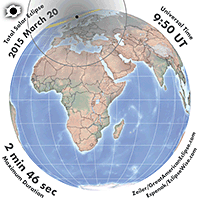
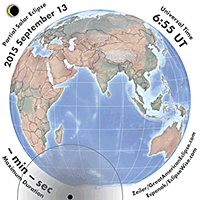
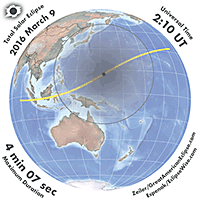
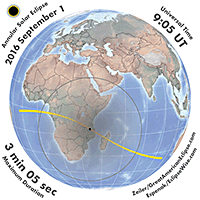
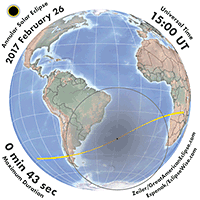

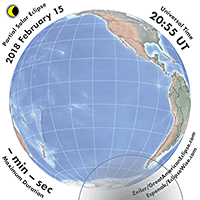

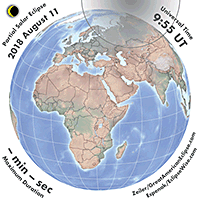
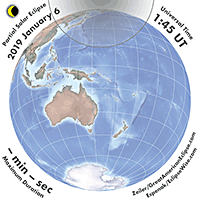
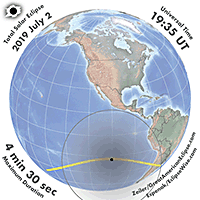
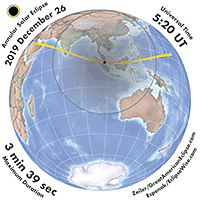
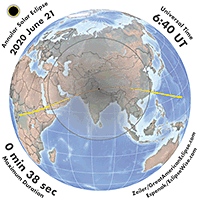
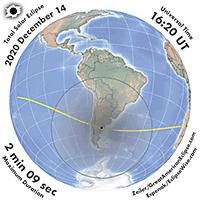
Table of Solar Eclipses: 2011 through 2020
A concise summary of all solar eclipses from 2011 through 2020 is presented in the table below. The first column gives the Calendar Date of the instant of greatest eclipse. The second column TD of Greatest Eclipse is the Terrestrial Dynamical Time (TD) when the axis of the Moon's shadow passes closest to Earth's center. The third column lists the Eclipse Type which is either Total, Annular, Hybrid or Partial.
Eclipses recur over the Saros cycle, a period of approximately 18 years 11 days. Each eclipse belongs to the Saros Series shown in column 4. The Eclipse Magnitude gives the fraction of the Sun's diameter obscured at the instant of greatest eclipse (column 5). For total and annular eclipses, the Central Duration gives the length of the eclipse as seen from the central line at greatest eclipse (column 6). Finally, the Geographic Region of Eclipse Visibility provides a brief description of where each eclipse will be seen. Countries and regions within the path of total or annular eclipses are listed in italics inside [ ] brackets.
The eclipse date (first column) links to the EclipseWise Prime Page for the eclipse. This page features a map showing the geographic region of eclipse visibility as well as detailed predictions, Besellian elements and links to additional information about the eclipse.
The Key to Solar Eclipse Decade Table contains a more detailed description of each item in the table.
| Solar Eclipses: 2011 - 2020 | ||||||
| Calendar Date | TD of Greatest Eclipse | Eclipse Type | Saros Series | Eclipse Magn. | Central Duration | Geographic Region of Eclipse Visibility |
| 2011 Jan 04 | 08:51:42 | Partial | 151 | 0.858 | - | Europe, Africa, c Asia |
| 2011 Jun 01 | 21:17:18 | Partial | 118 | 0.601 | - | e Asia, n North America, Iceland |
| 2011 Jul 01 | 08:39:30 | Partial | 156 | 0.097 | - | s Indian Ocean |
| 2011 Nov 25 | 06:21:25 | Partial | 123 | 0.905 | - | s Africa, Antarctica, Tasmania, New Zealand |
| 2012 May 20 | 23:53:54 | Annular | 128 | 0.944 | 05m46s | Asia, Pacific, North America
[Annular: China, Japan, Pacific, w U.S.] |
| 2012 Nov 13 | 22:12:55 | Total | 133 | 1.050 | 04m02s | Australia, New Zealand, s Pacific, s South America
[Total: n Australia, s Pacific] |
| 2013 May 10 | 00:26:20 | Annular | 138 | 0.954 | 06m03s | Australia, New Zealand, c Pacific
[Annular: n Australia, Solomon Is., c Pacific] |
| 2013 Nov 03 | 12:47:36 | Hybrid | 143 | 1.016 | 01m40s | e Americas, s Europe, Africa
[Hybid: Atlantic, c Africa] |
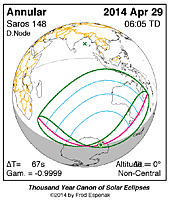
| 2014 Apr 29 | 06:04:33 | Annular | 148 | 0.987 | - | s Indian, Australia, Antarctica
[Annular: Antarctica] |
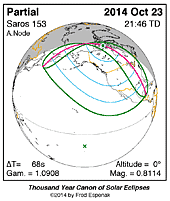
| 2014 Oct 23 | 21:45:39 | Partial | 153 | 0.811 | - | n Pacific, North America |
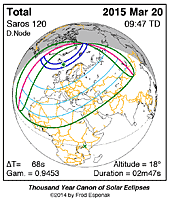
| 2015 Mar 20 | 09:46:47 | Total | 120 | 1.045 | 02m47s | Iceland, Europe, n Africa, n Asia
[Total: n Atlantic, Faeroe Is, Svalbard] |
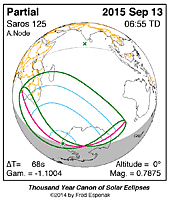
| 2015 Sep 13 | 06:55:19 | Partial | 125 | 0.787 | - | s Africa, s Indian, Antarctica |
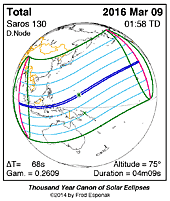
| 2016 Mar 09 | 01:58:19 | Total | 130 | 1.045 | 04m09s | e Asia, Australia, Pacific
[Total: Sumatra, Borneo, Sulawesi, Pacific] |
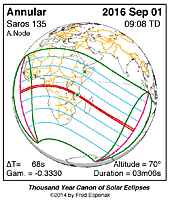
| 2016 Sep 01 | 09:08:02 | Annular | 135 | 0.974 | 03m06s | Africa, Indian Ocean
[Annular: Atlantic, c Africa, Madagascar, Indian] |
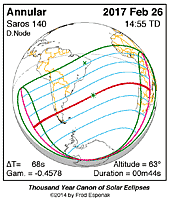
| 2017 Feb 26 | 14:54:33 | Annular | 140 | 0.992 | 00m44s | s South America, Atlantic, Africa, Antarctica
[Annular: Pacific, Chile, Argentina, Atlantic, Africa] |
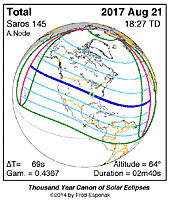
| 2017 Aug 21 | 18:26:40 | Total | 145 | 1.031 | 02m40s | North America, n South America
[Total: n Pacific, U.S., s Atlantic] |
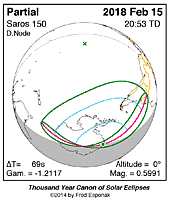
| 2018 Feb 15 | 20:52:33 | Partial | 150 | 0.599 | - | Antarctica, s South America |
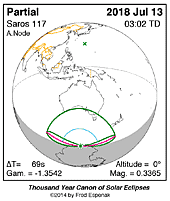
| 2018 Jul 13 | 03:02:16 | Partial | 117 | 0.337 | - | s Australia |
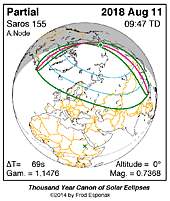
| 2018 Aug 11 | 09:47:28 | Partial | 155 | 0.737 | - | n Europe, ne Asia |
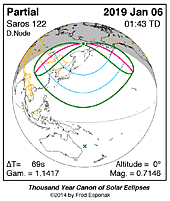
| 2019 Jan 06 | 01:42:38 | Partial | 122 | 0.715 | - | ne Asia, n Pacific |
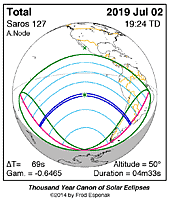
| 2019 Jul 02 | 19:24:07 | Total | 127 | 1.046 | 04m33s | s Pacific, South America
[Total: s Pacific, Chile, Argentina] |
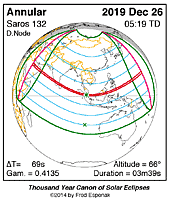
| 2019 Dec 26 | 05:18:53 | Annular | 132 | 0.970 | 03m39s | Asia, Australia
[Annular: Saudi Arabia, India, Sumatra, Borneo] |
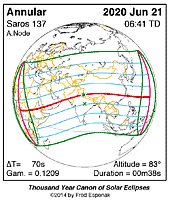
| 2020 Jun 21 | 06:41:15 | Annular | 137 | 0.994 | 00m38s | Africa, se Europe, Asia
[Annular: c Africa, s Asia, China, Pacific] |
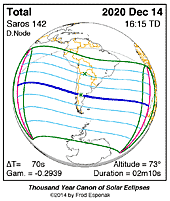
| 2020 Dec 14 | 16:14:39 | Total | 142 | 1.025 | 02m10s | Pacific, s South America, Antarctica
[Total: s Pacific, Chile, Argentina, s Atlantic] |
Geographic abbreviations (used above): n = north, s = south, e = east, w = west, c = central
Links to Solar Eclipse Predictions
Decade Tables of Solar Eclipses
Each link in the following table displays a page containing 10 years of solar eclipses. Every eclipse has links to a global map, an interactive Google map, and a dedicated web page for that eclipse.
| Decade Tables of Solar Eclipses | |||||
| Decades | |||||
|---|---|---|---|---|---|
| 1901-1910 | 1911-1920 | 1921-1930 | 1931-1940 | 1941-1950 | |
| 1951-1960 | 1961-1970 | 1971-1980 | 1981-1990 | 1991-2000 | |
| 2001-2010 | 2011-2020 | 2021-2030 | 2031-2040 | 2041-2050 | |
| 2051-2060 | 2061-2070 | 2071-2080 | 2081-2090 | 2091-2100 | |
Century Catologs of Solar Eclipses
Each link in the following table displays a catalog containing 100 years of eclipses.
| Century Catalogs of Solar Eclipses | |||||
| Centuries | |||||
|---|---|---|---|---|---|
| 1001-1100 | 1101-1200 | 1201-1300 | 1301-1400 | 1401-1500 | |
| 1501-1600 | 1601-1700 | 1701-1800 | 1801-1900 | 1901-2000 | |
| 2001-2100 | 2101-2200 | 2201-2300 | 2301-2400 | 2401-2500 | |
| 2501-2600 | 2601-2700 | 2701-2800 | 2801-2900 | 2901-3000 | |
For other centuries, see Six Millennium Catalog of Solar Eclipses: -2999 to +3000
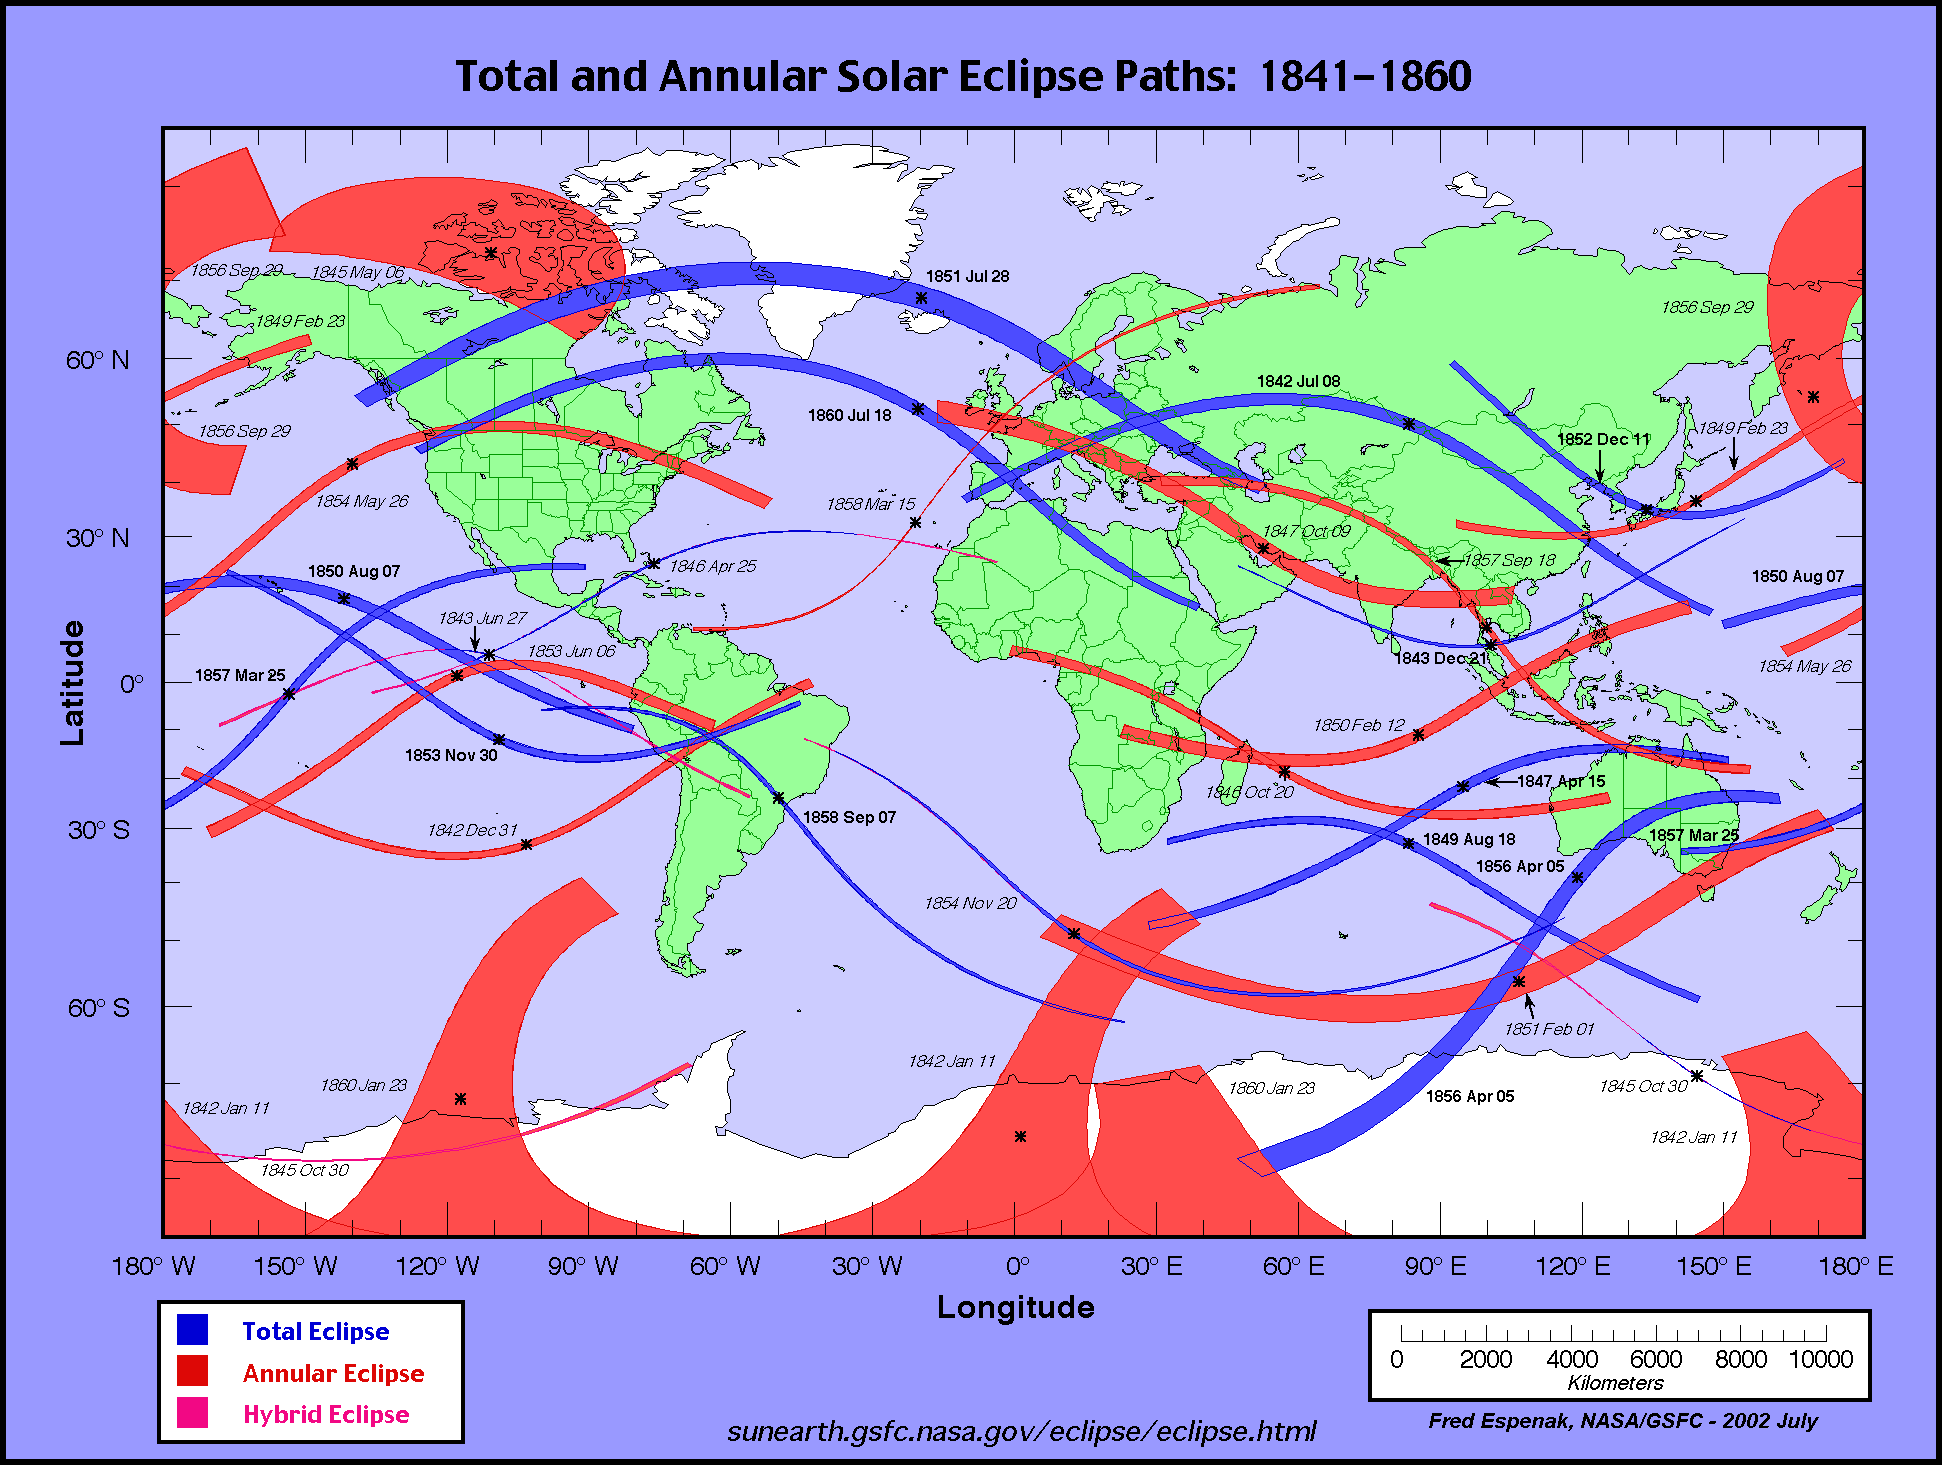
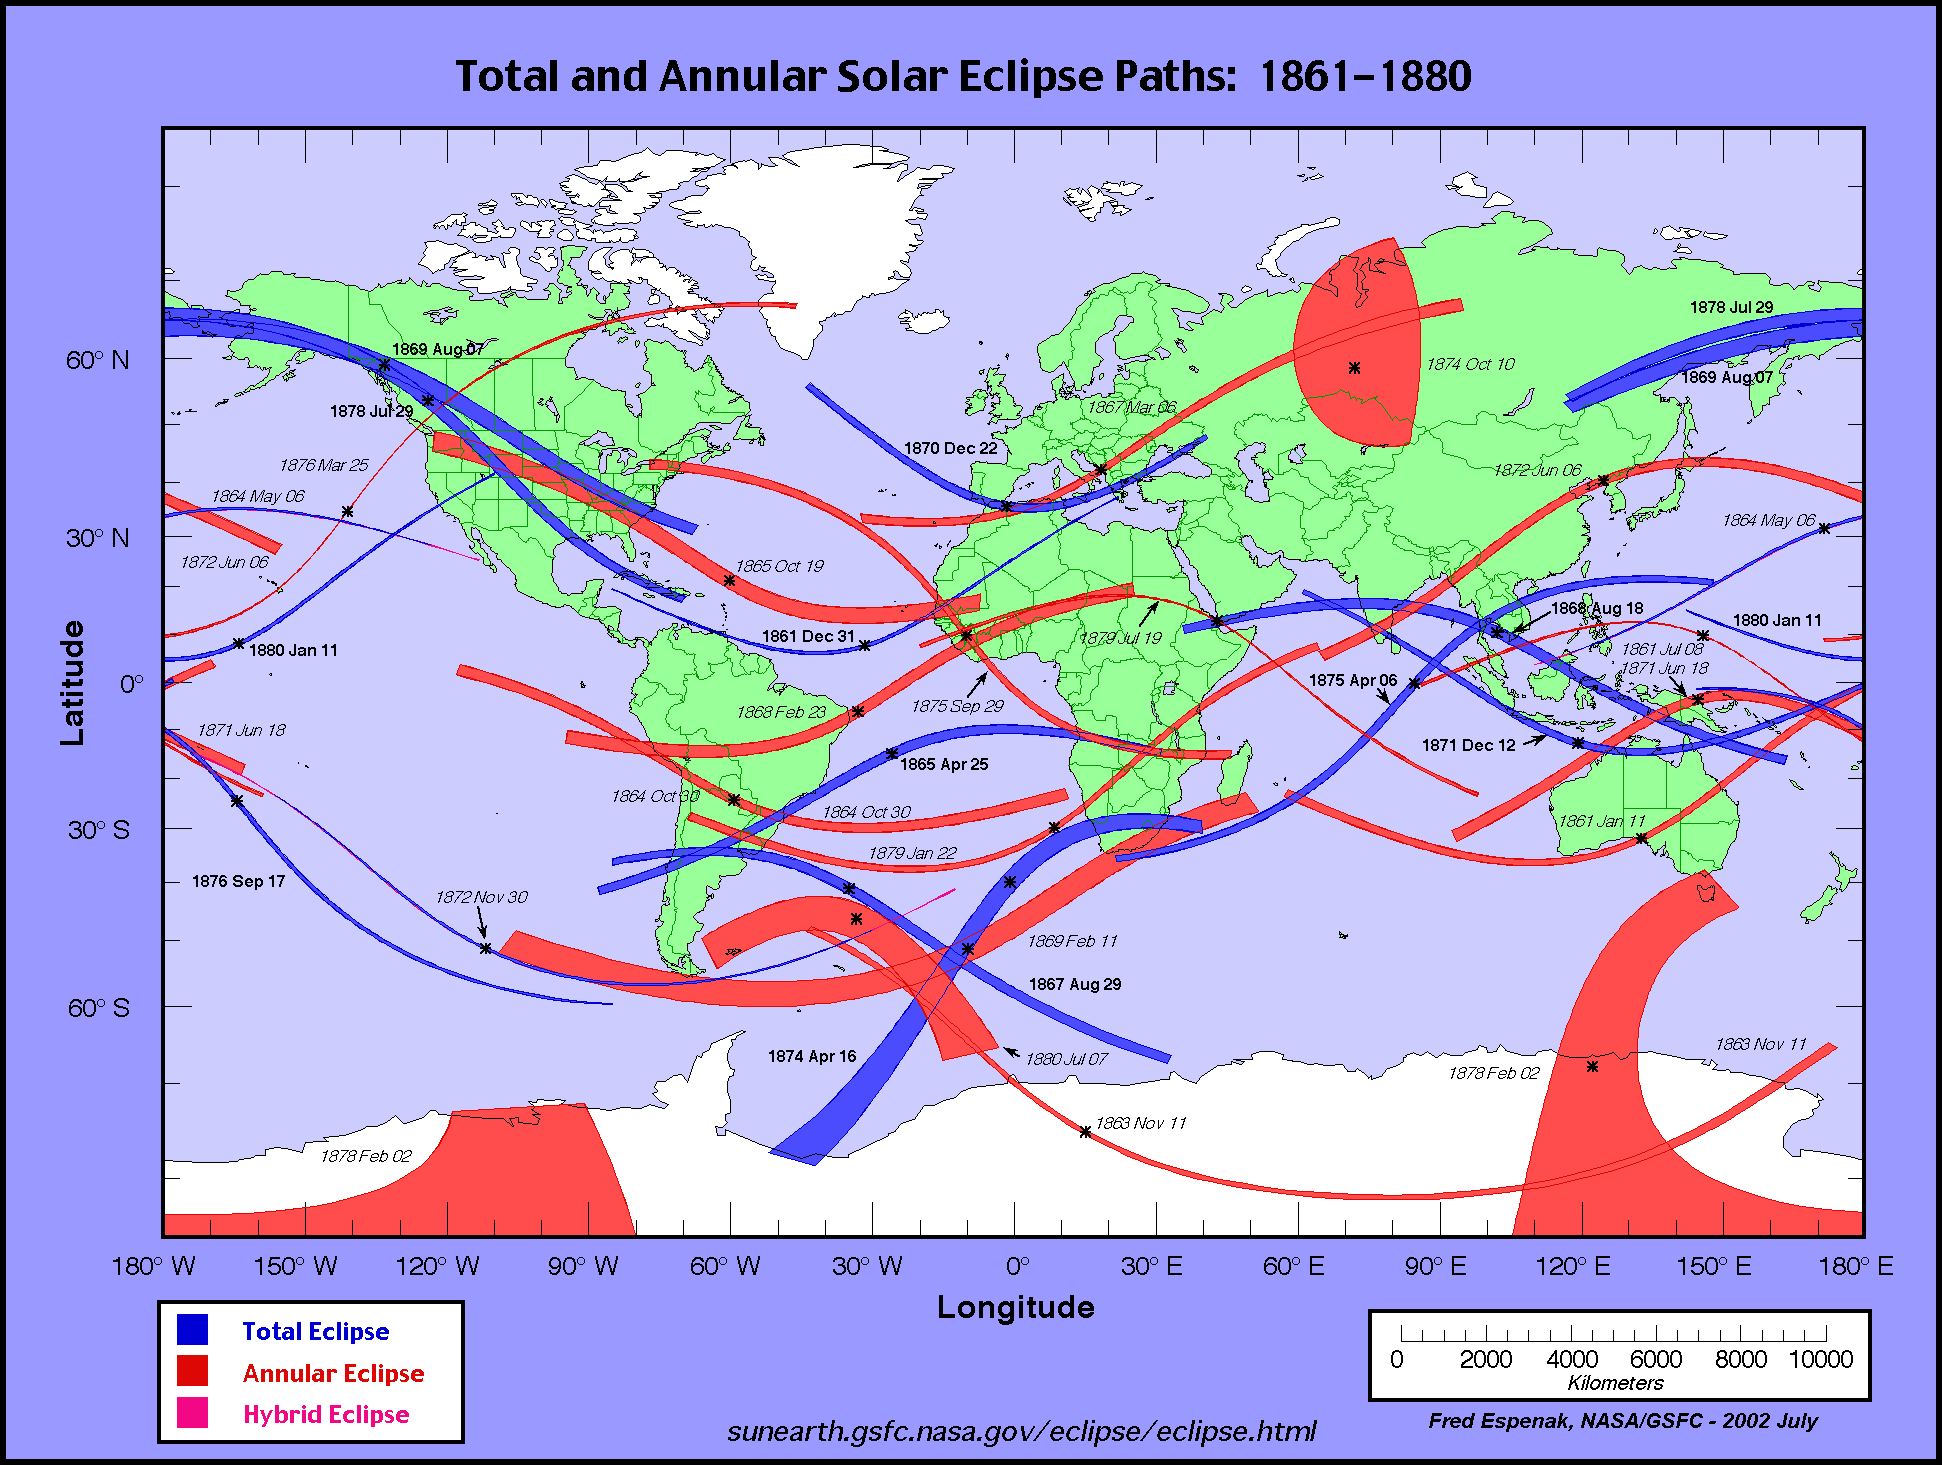
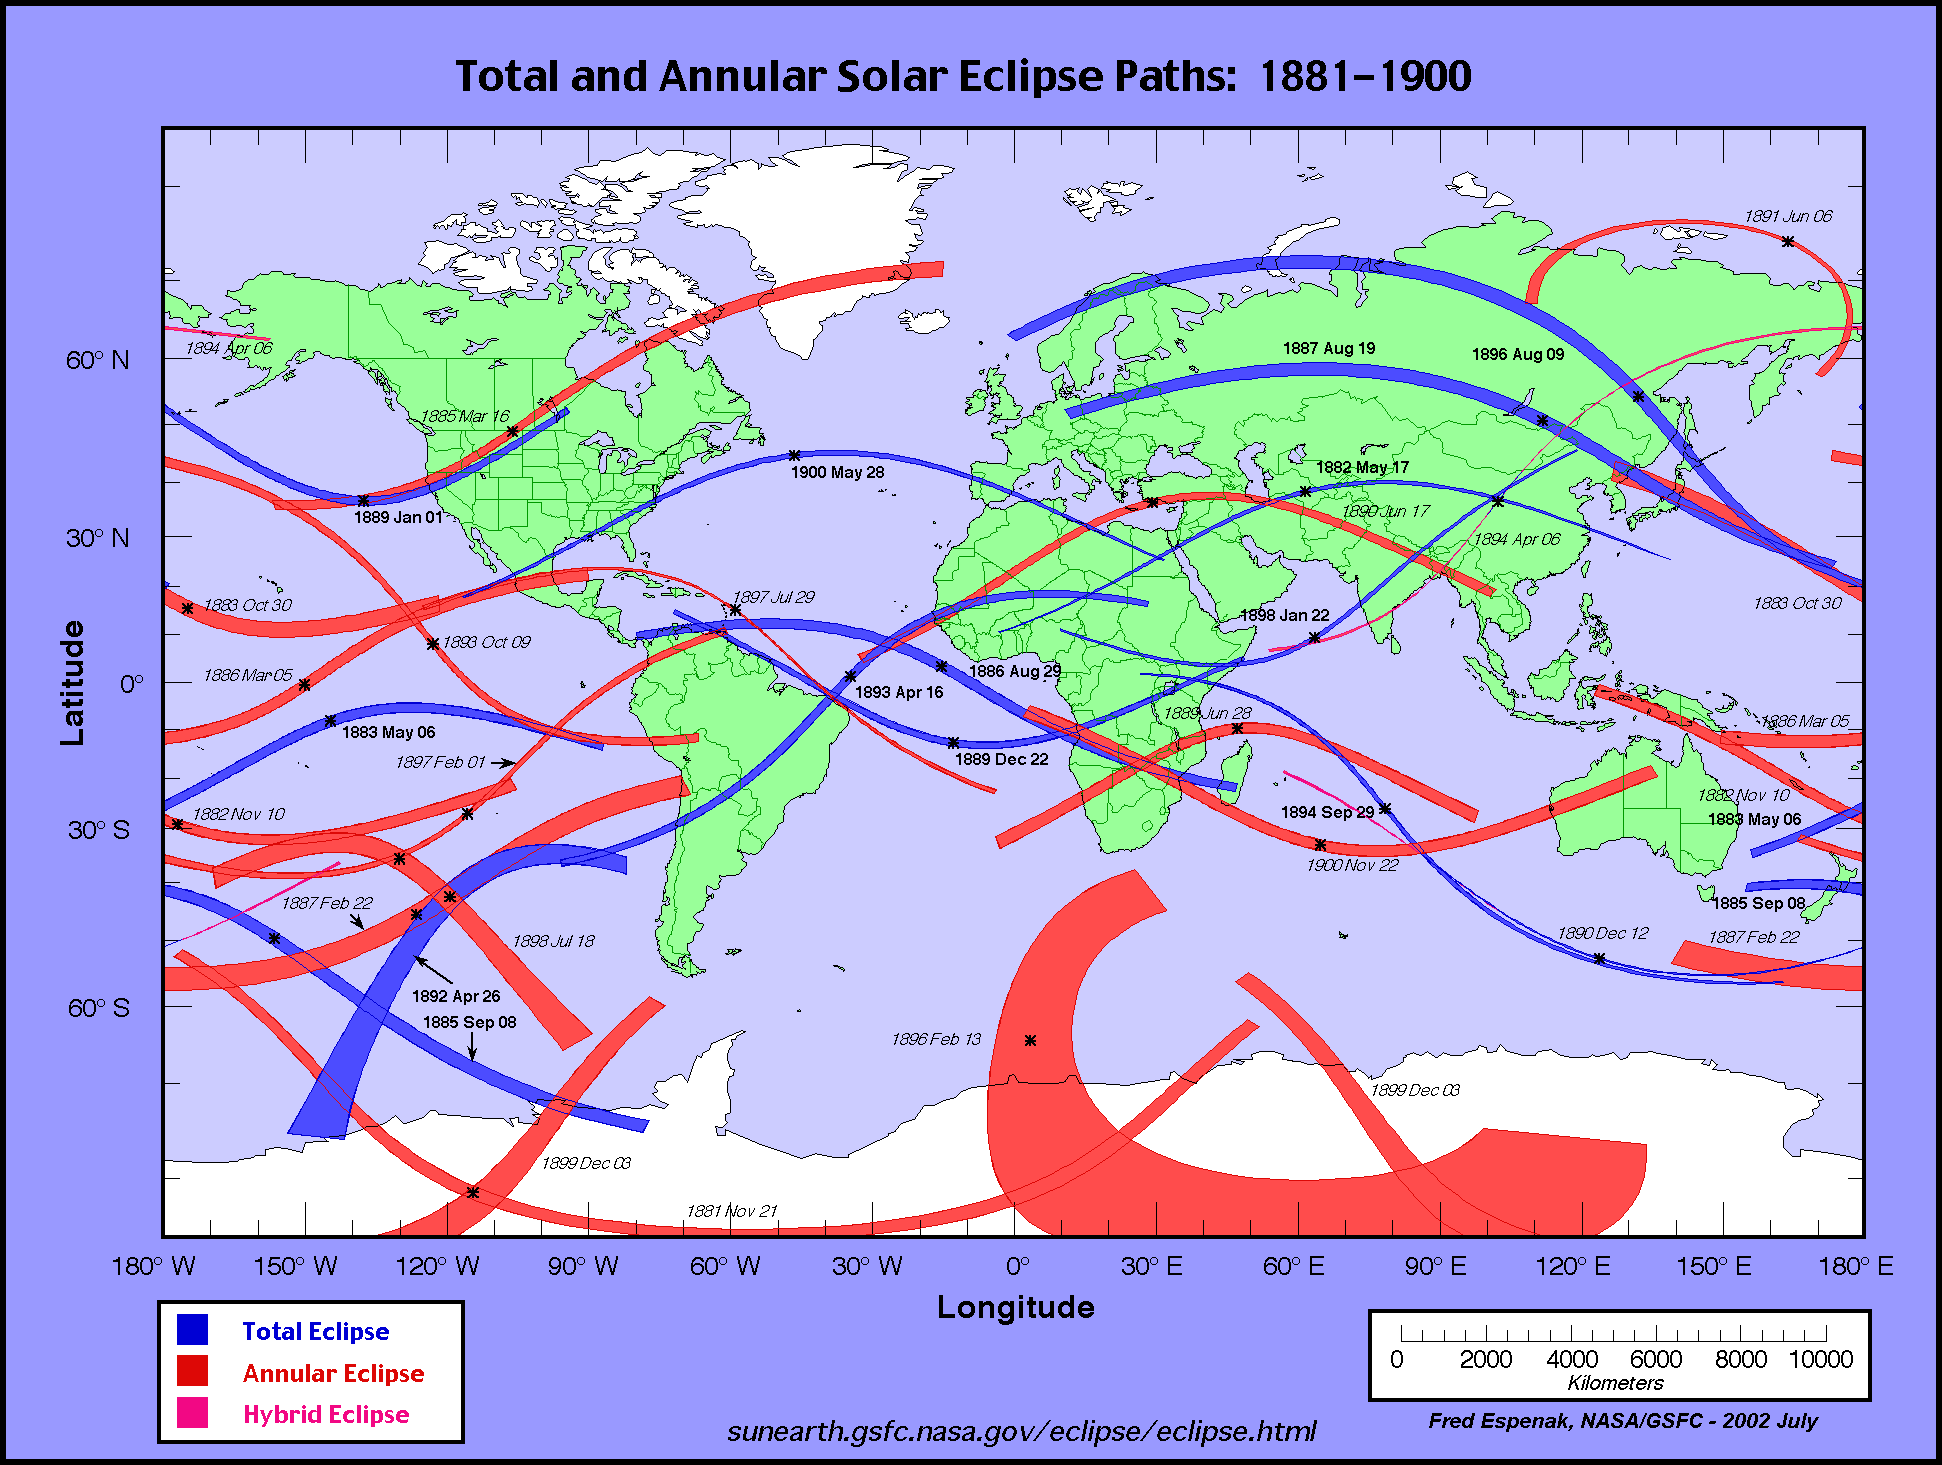
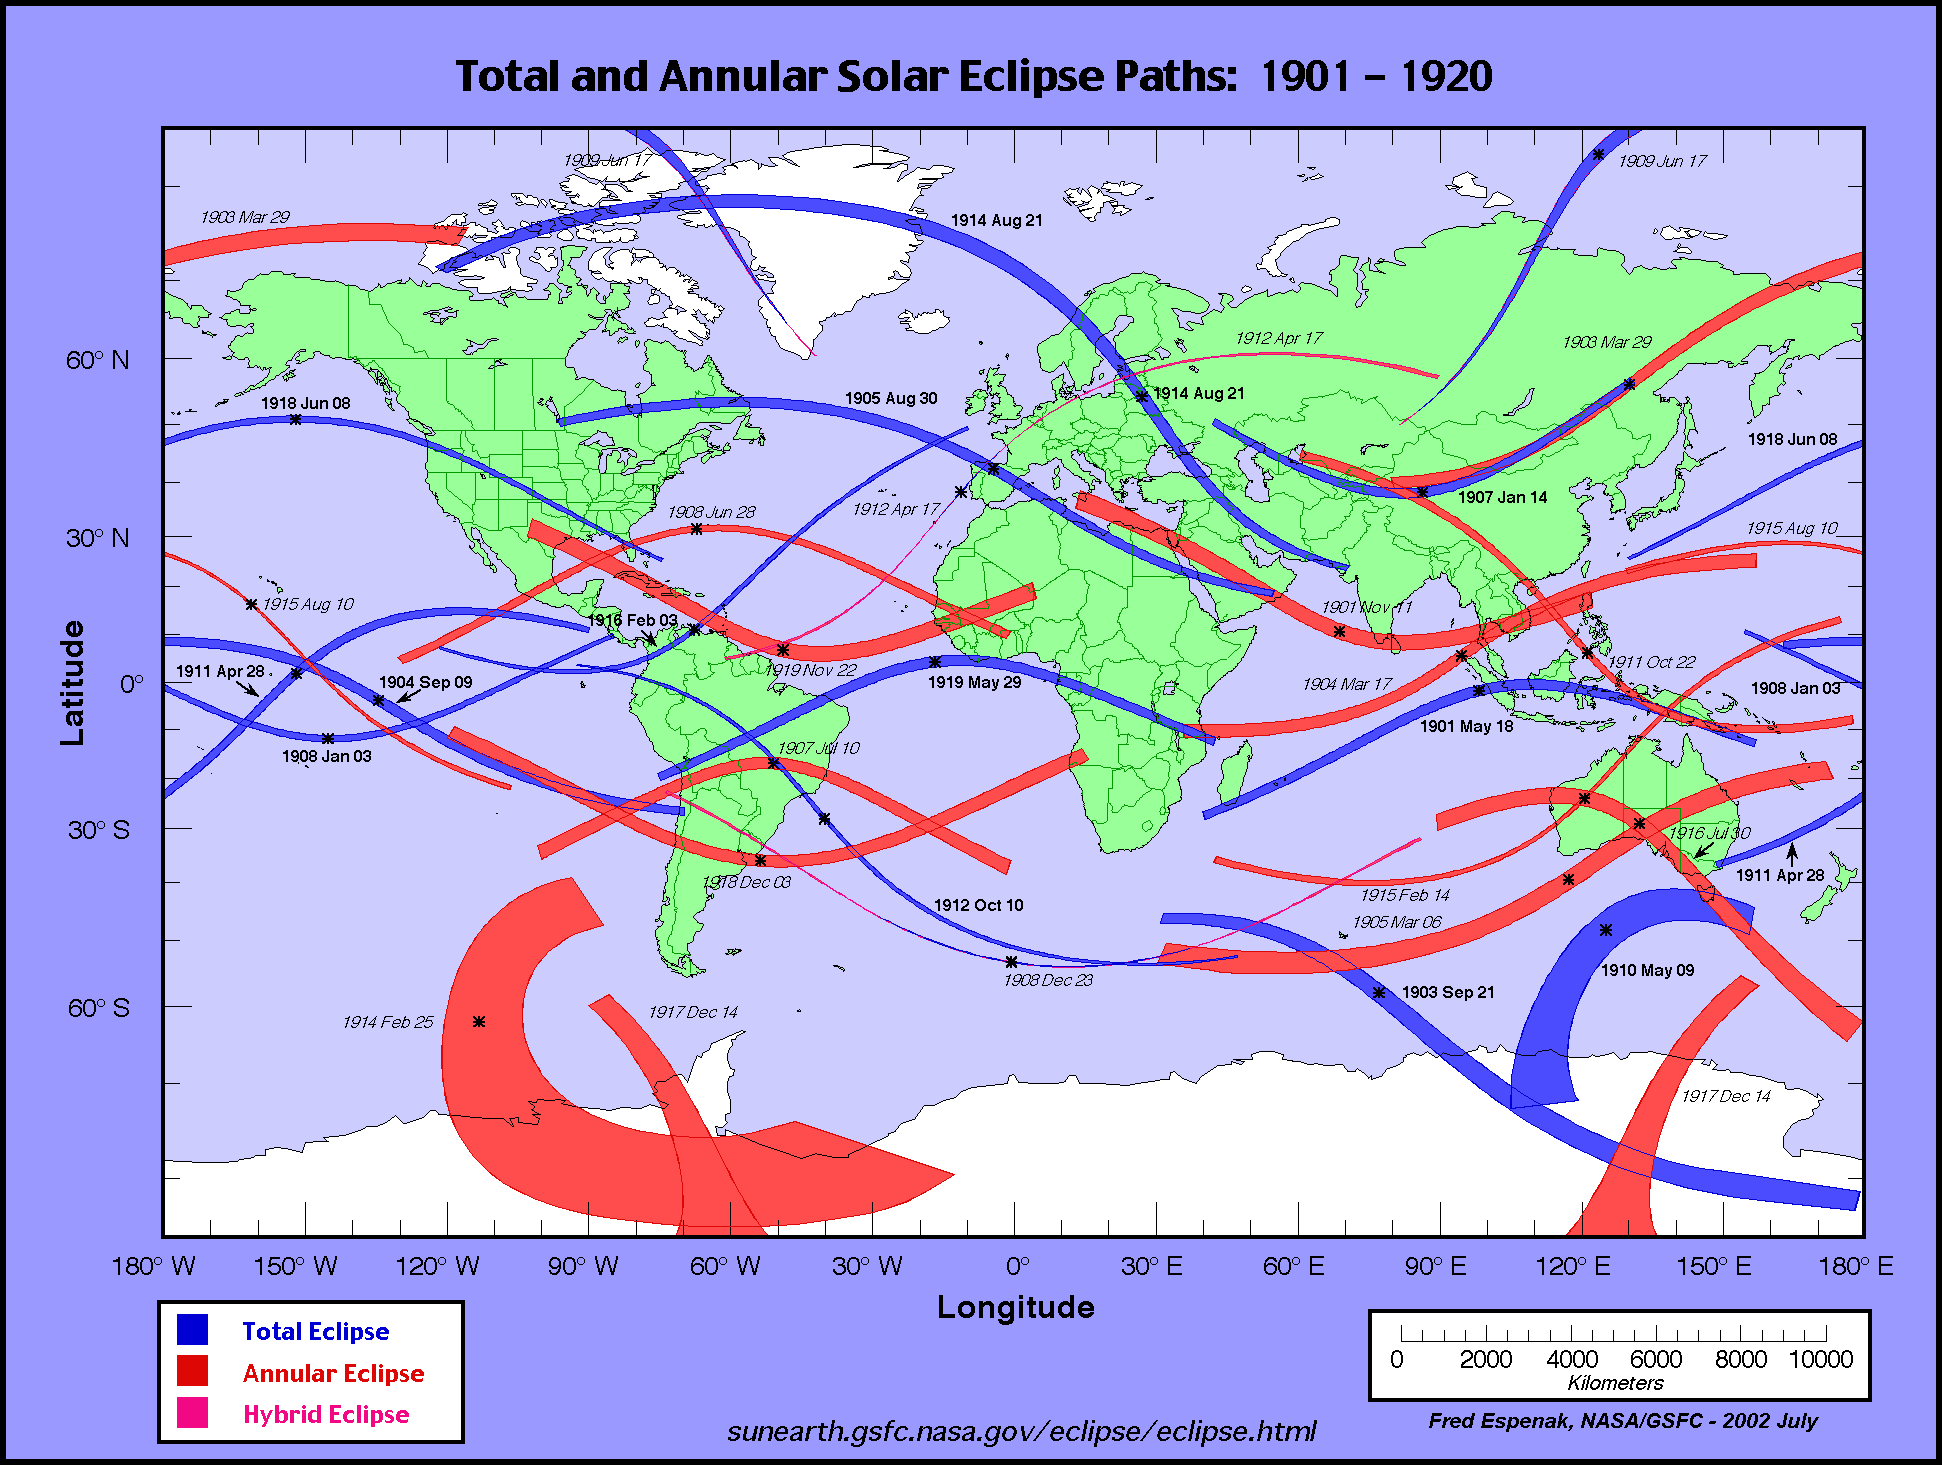
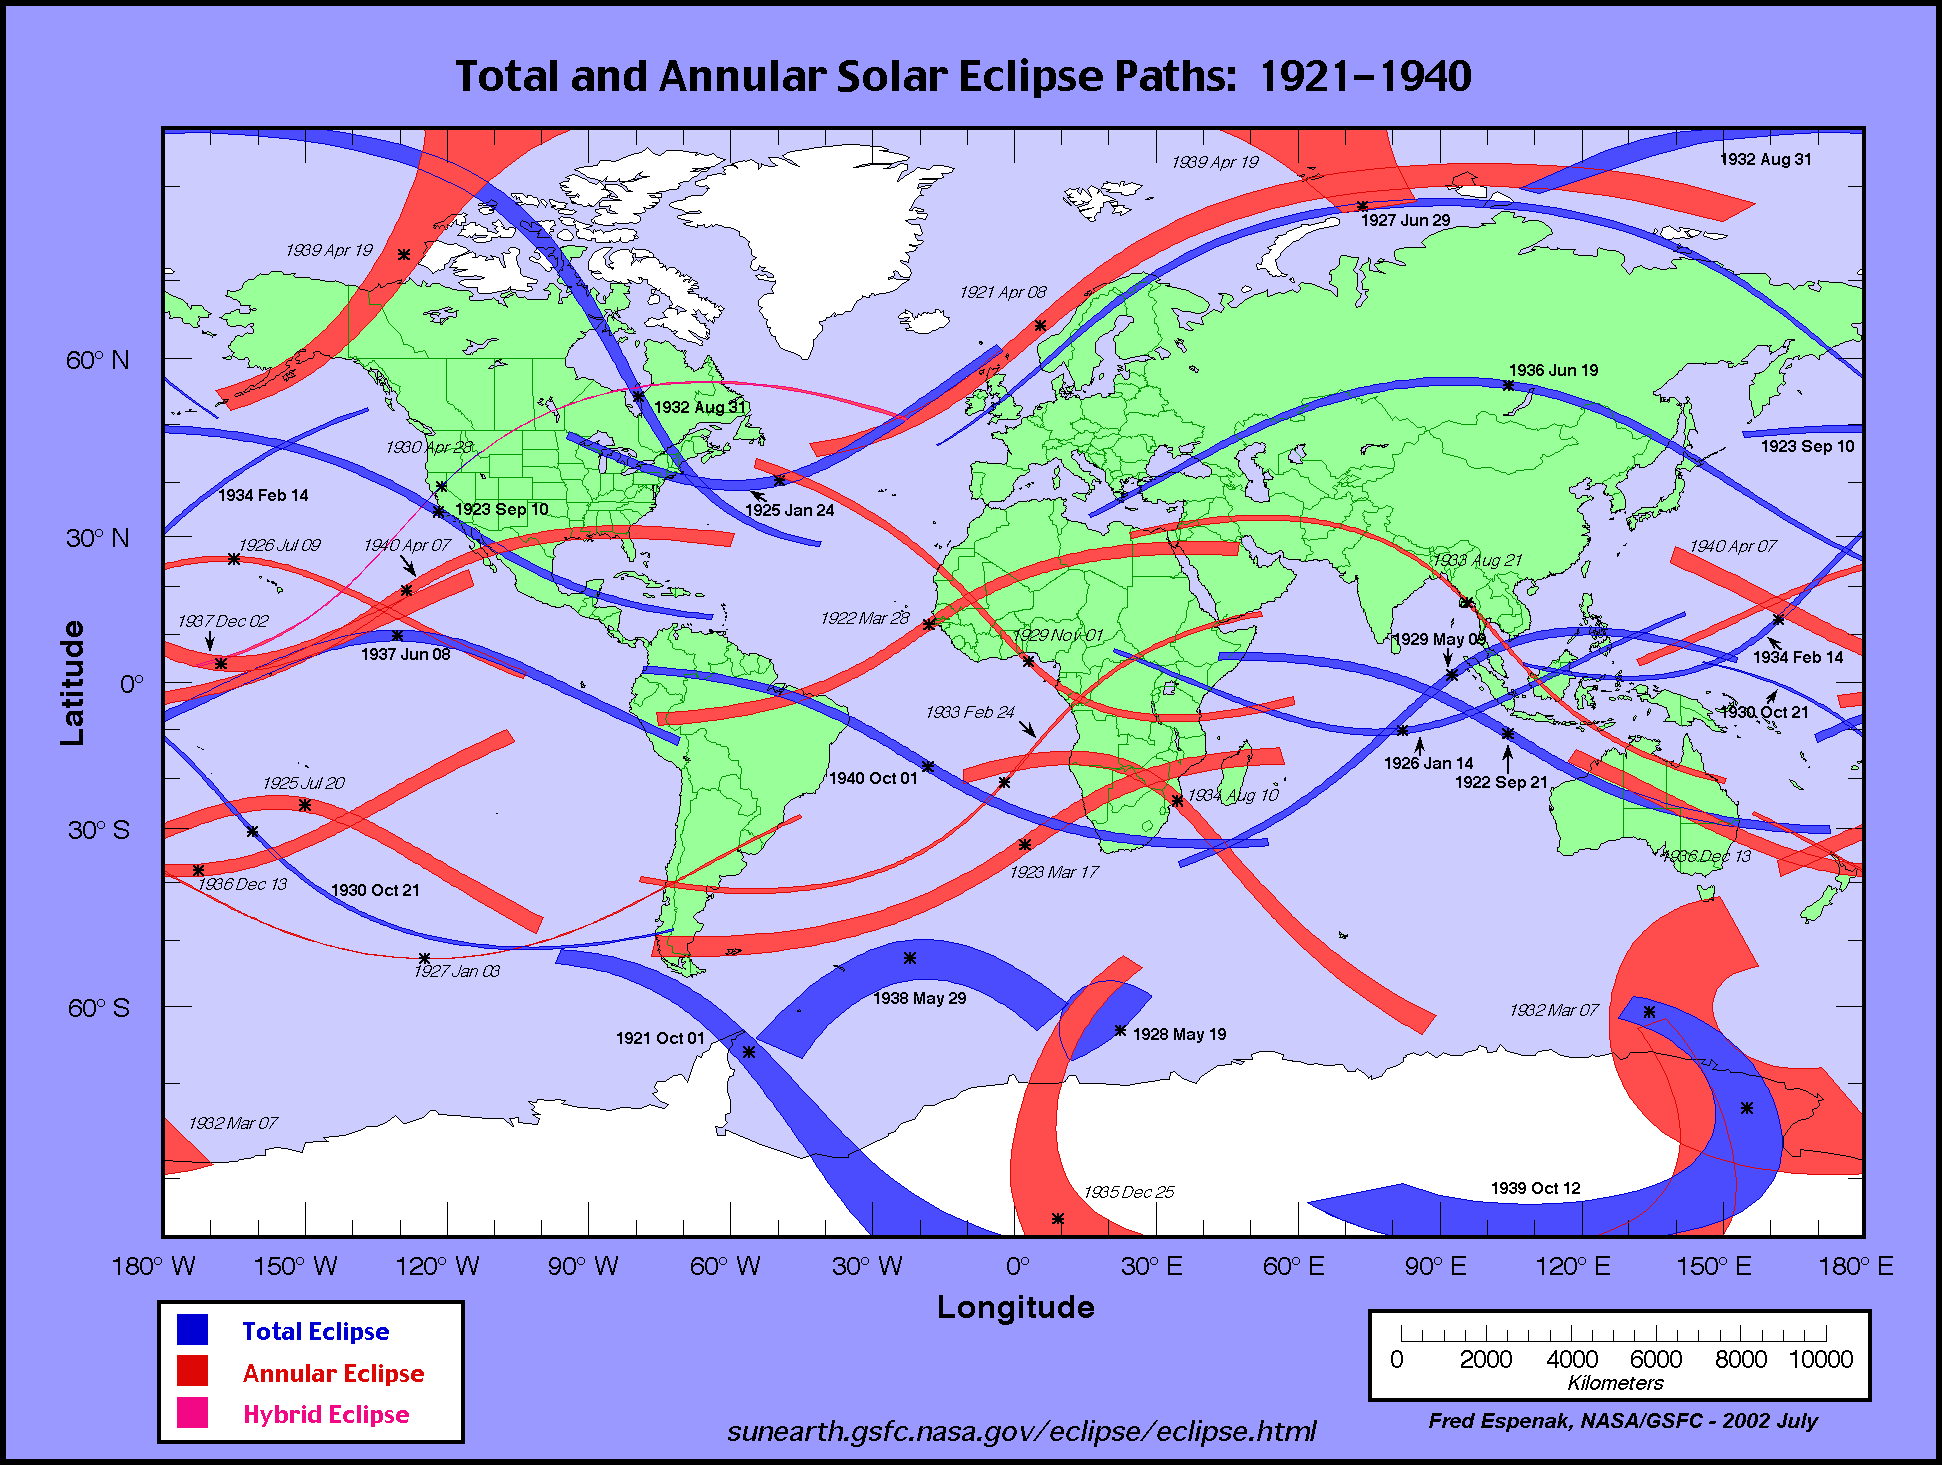
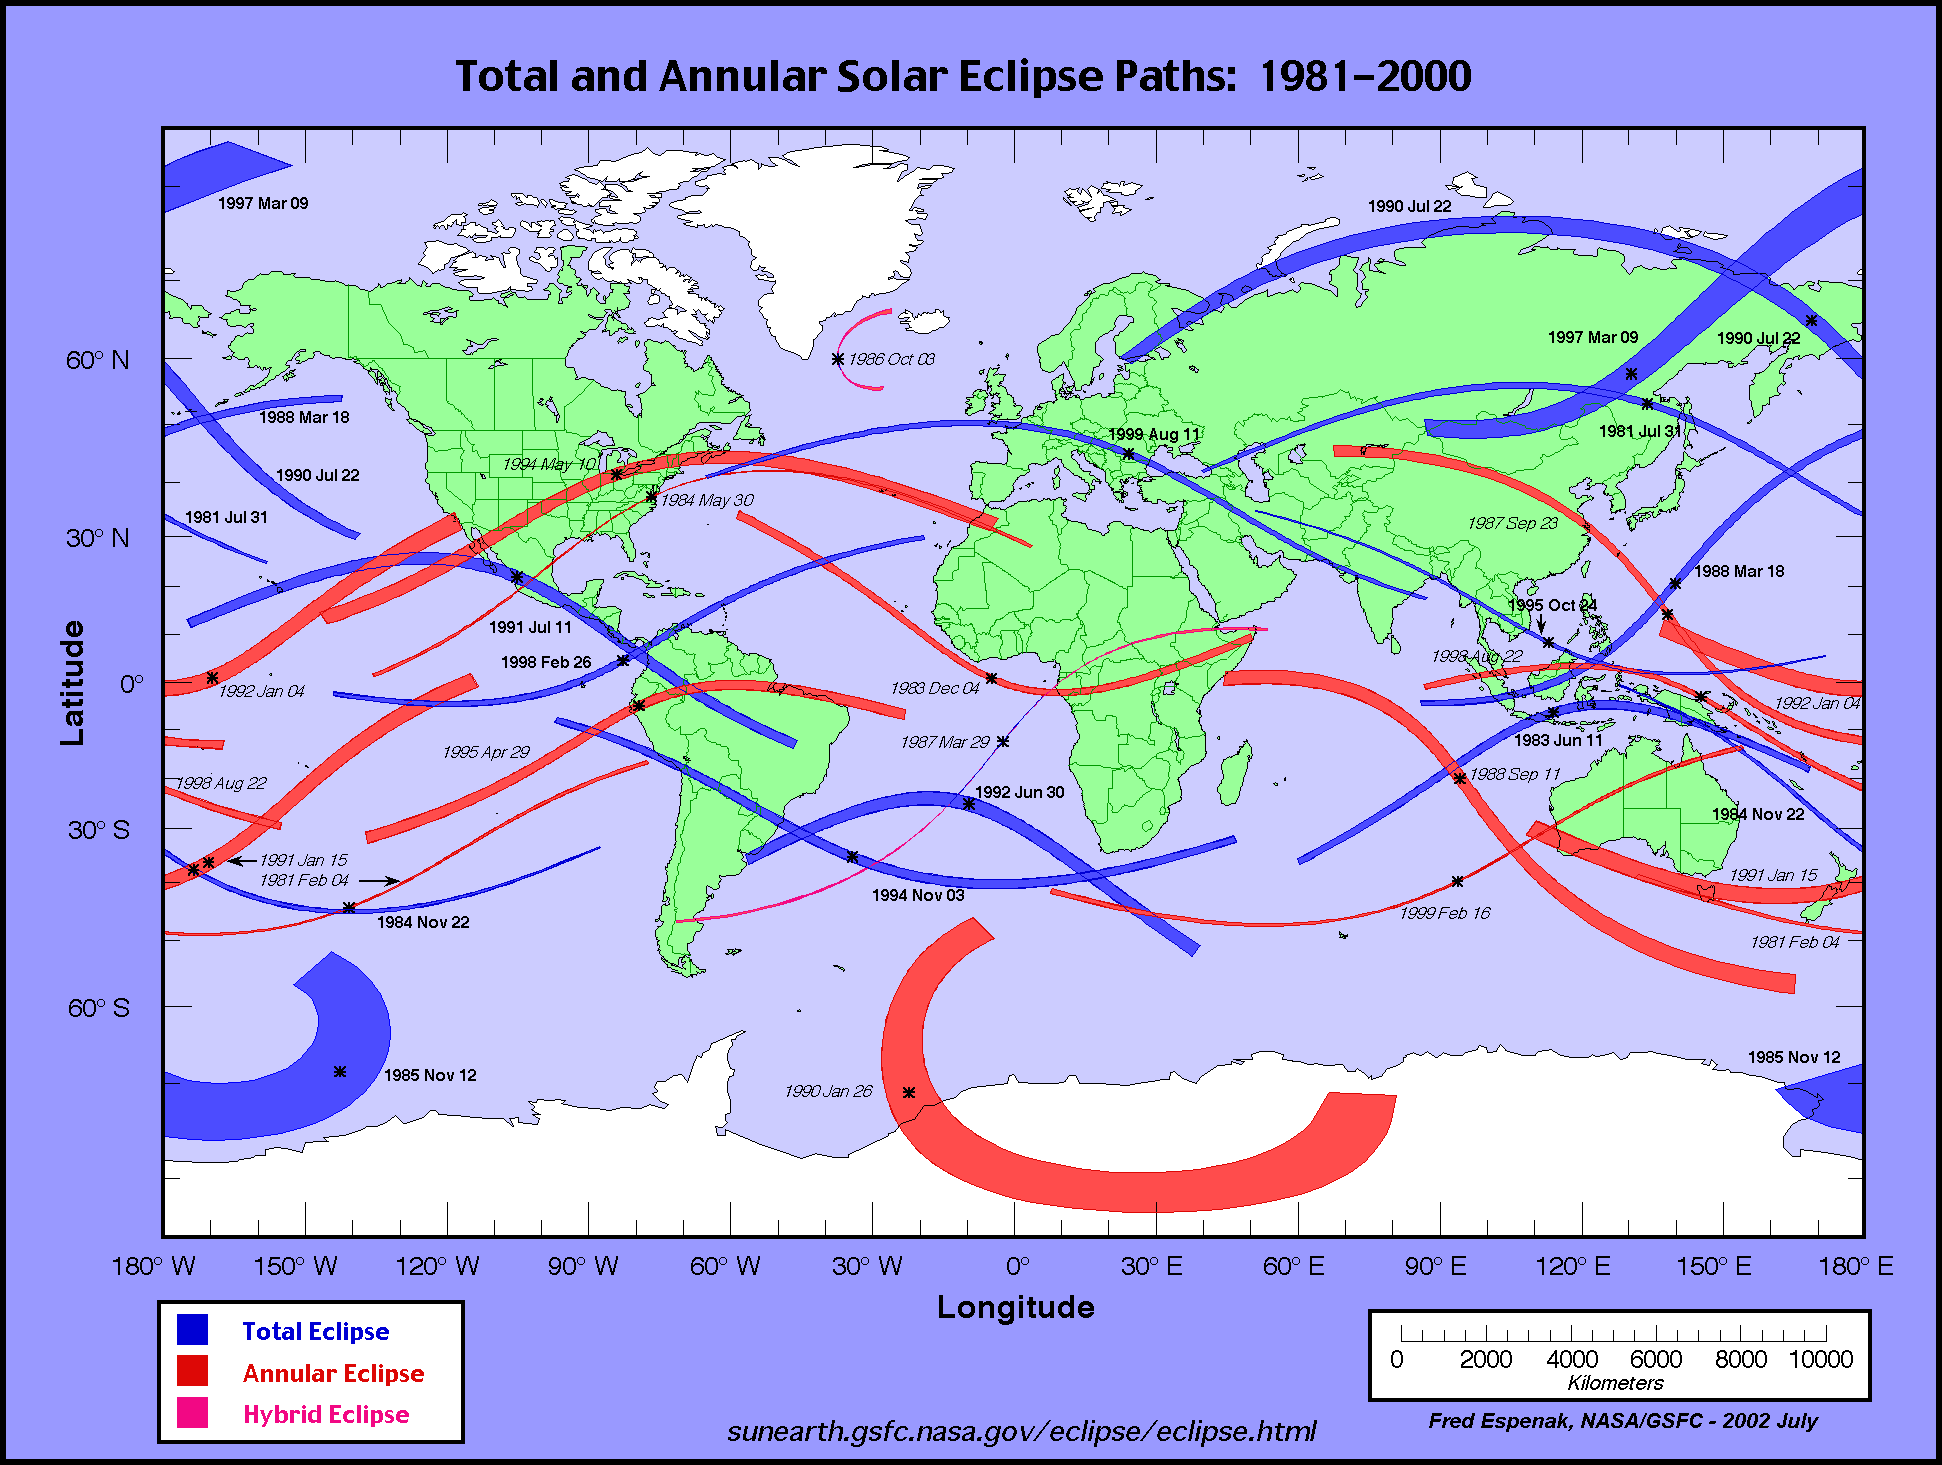
Maps of Solar Eclipse Paths
The World Atlas of Solar Eclipse Paths features maps showing the paths of all total, annular and hybrid eclipses. Each map in the atlas covers a 20-year period. The atlas spans five millennia from -1999 to +3000 (2000 BCE to 3000 CE).
| World Atlas of Solar Eclipse Paths | |||||
| 19th Century | 1801-1820 | 1821-1840 | 1841-1860 | 1861-1880 | 1881-1900 |
|---|---|---|---|---|---|
| 20th Century | 1901-1920 | 1921-1940 | 1941-1960 | 1961-1980 | 1981-2000 |
| 21st Century | 2001-2020 | 2021-2040 | 2041-2060 | 2061-2080 | 2081-2100 |
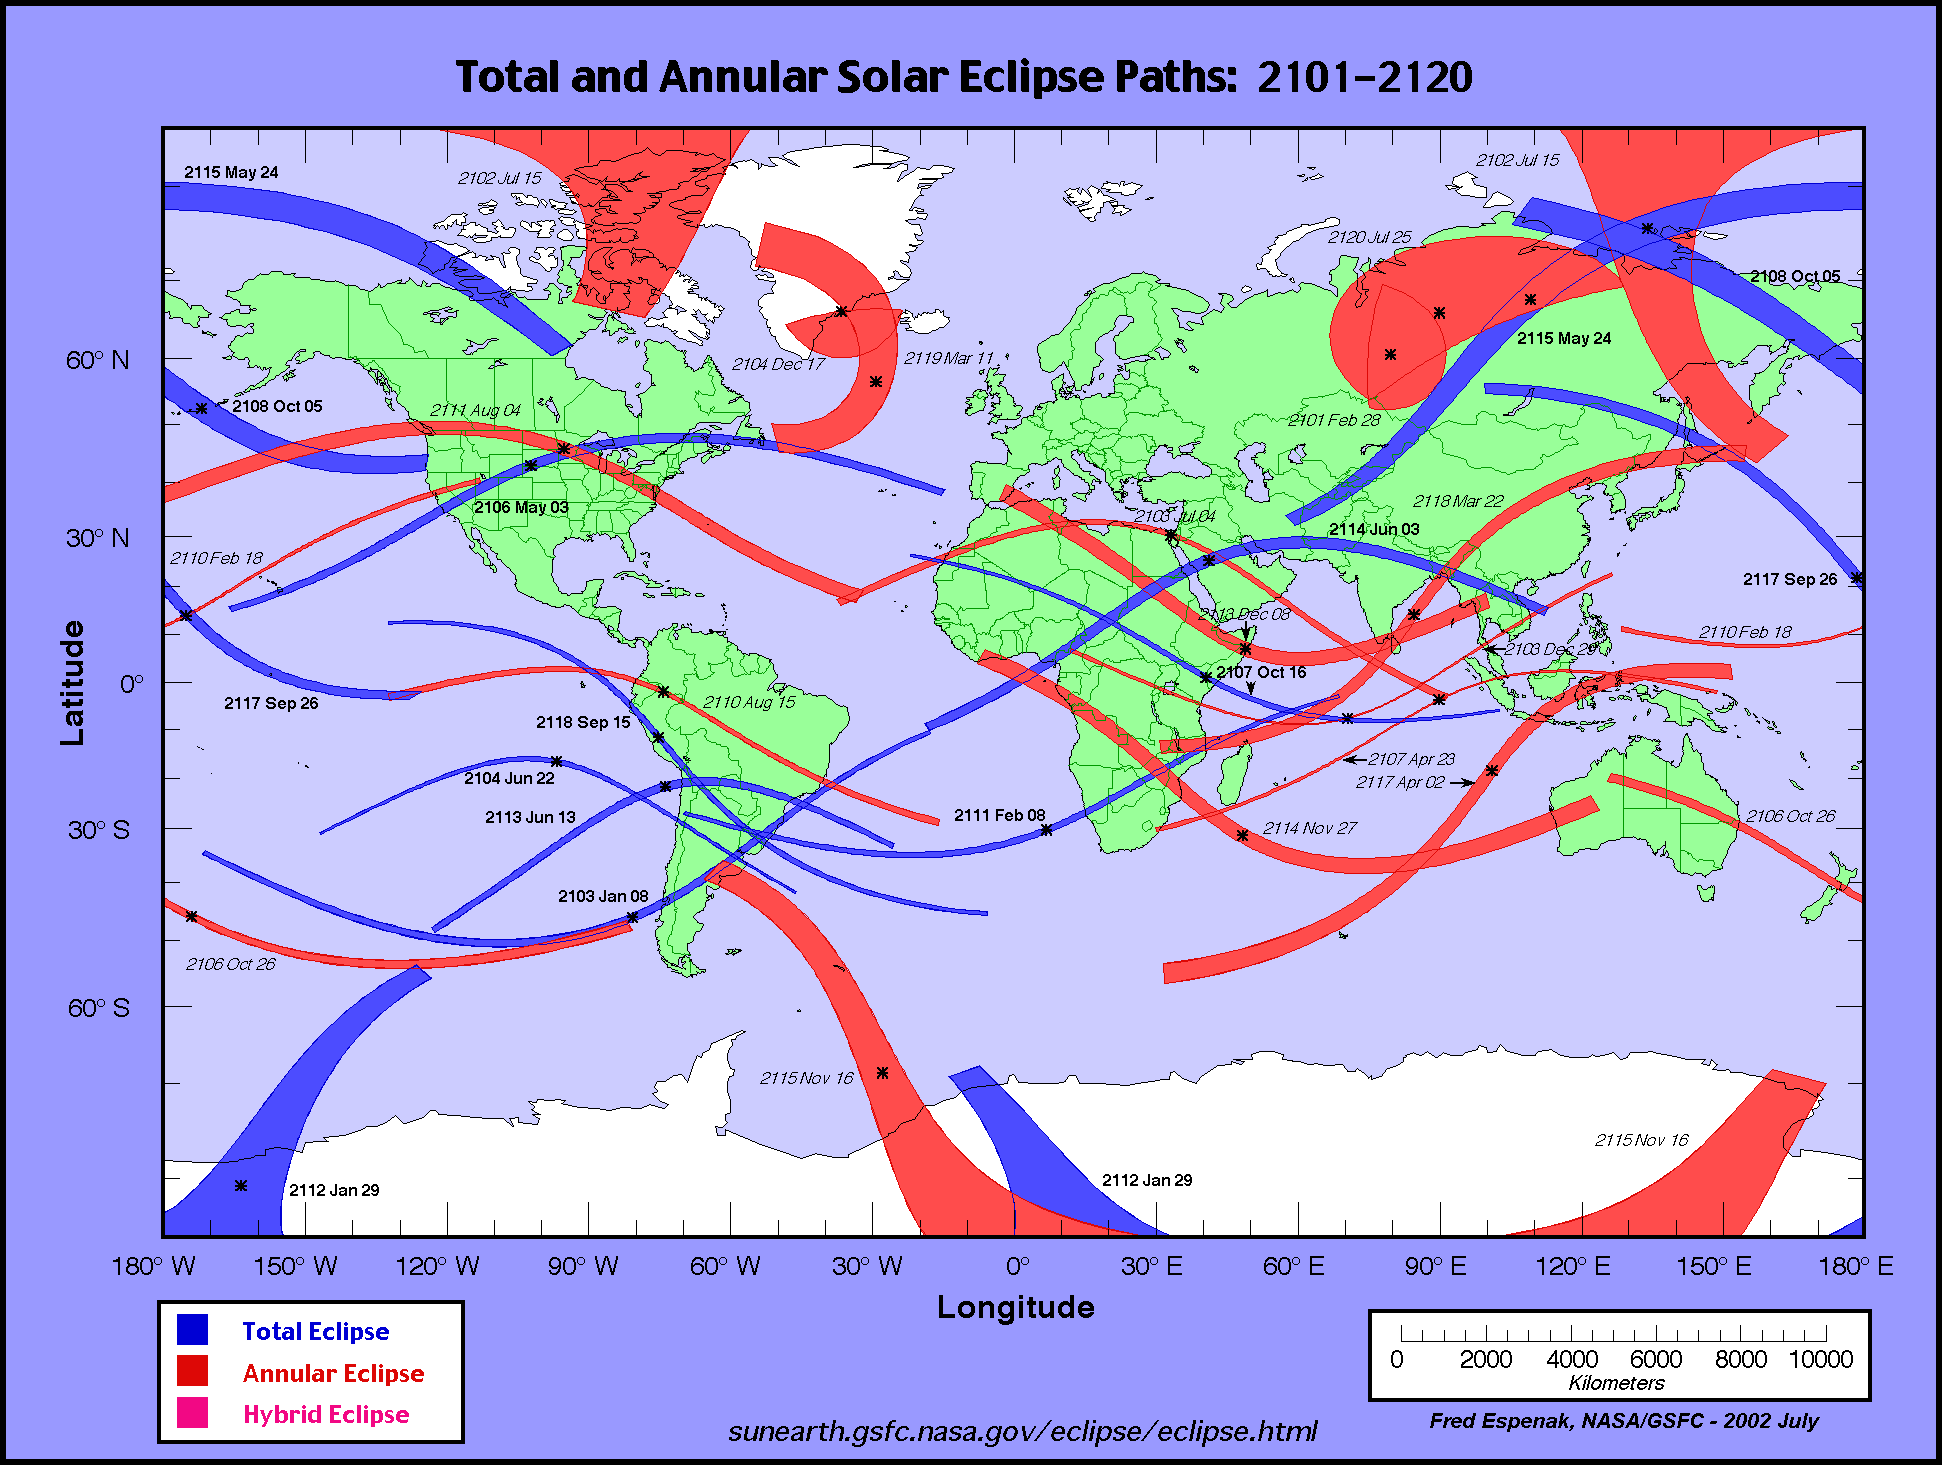
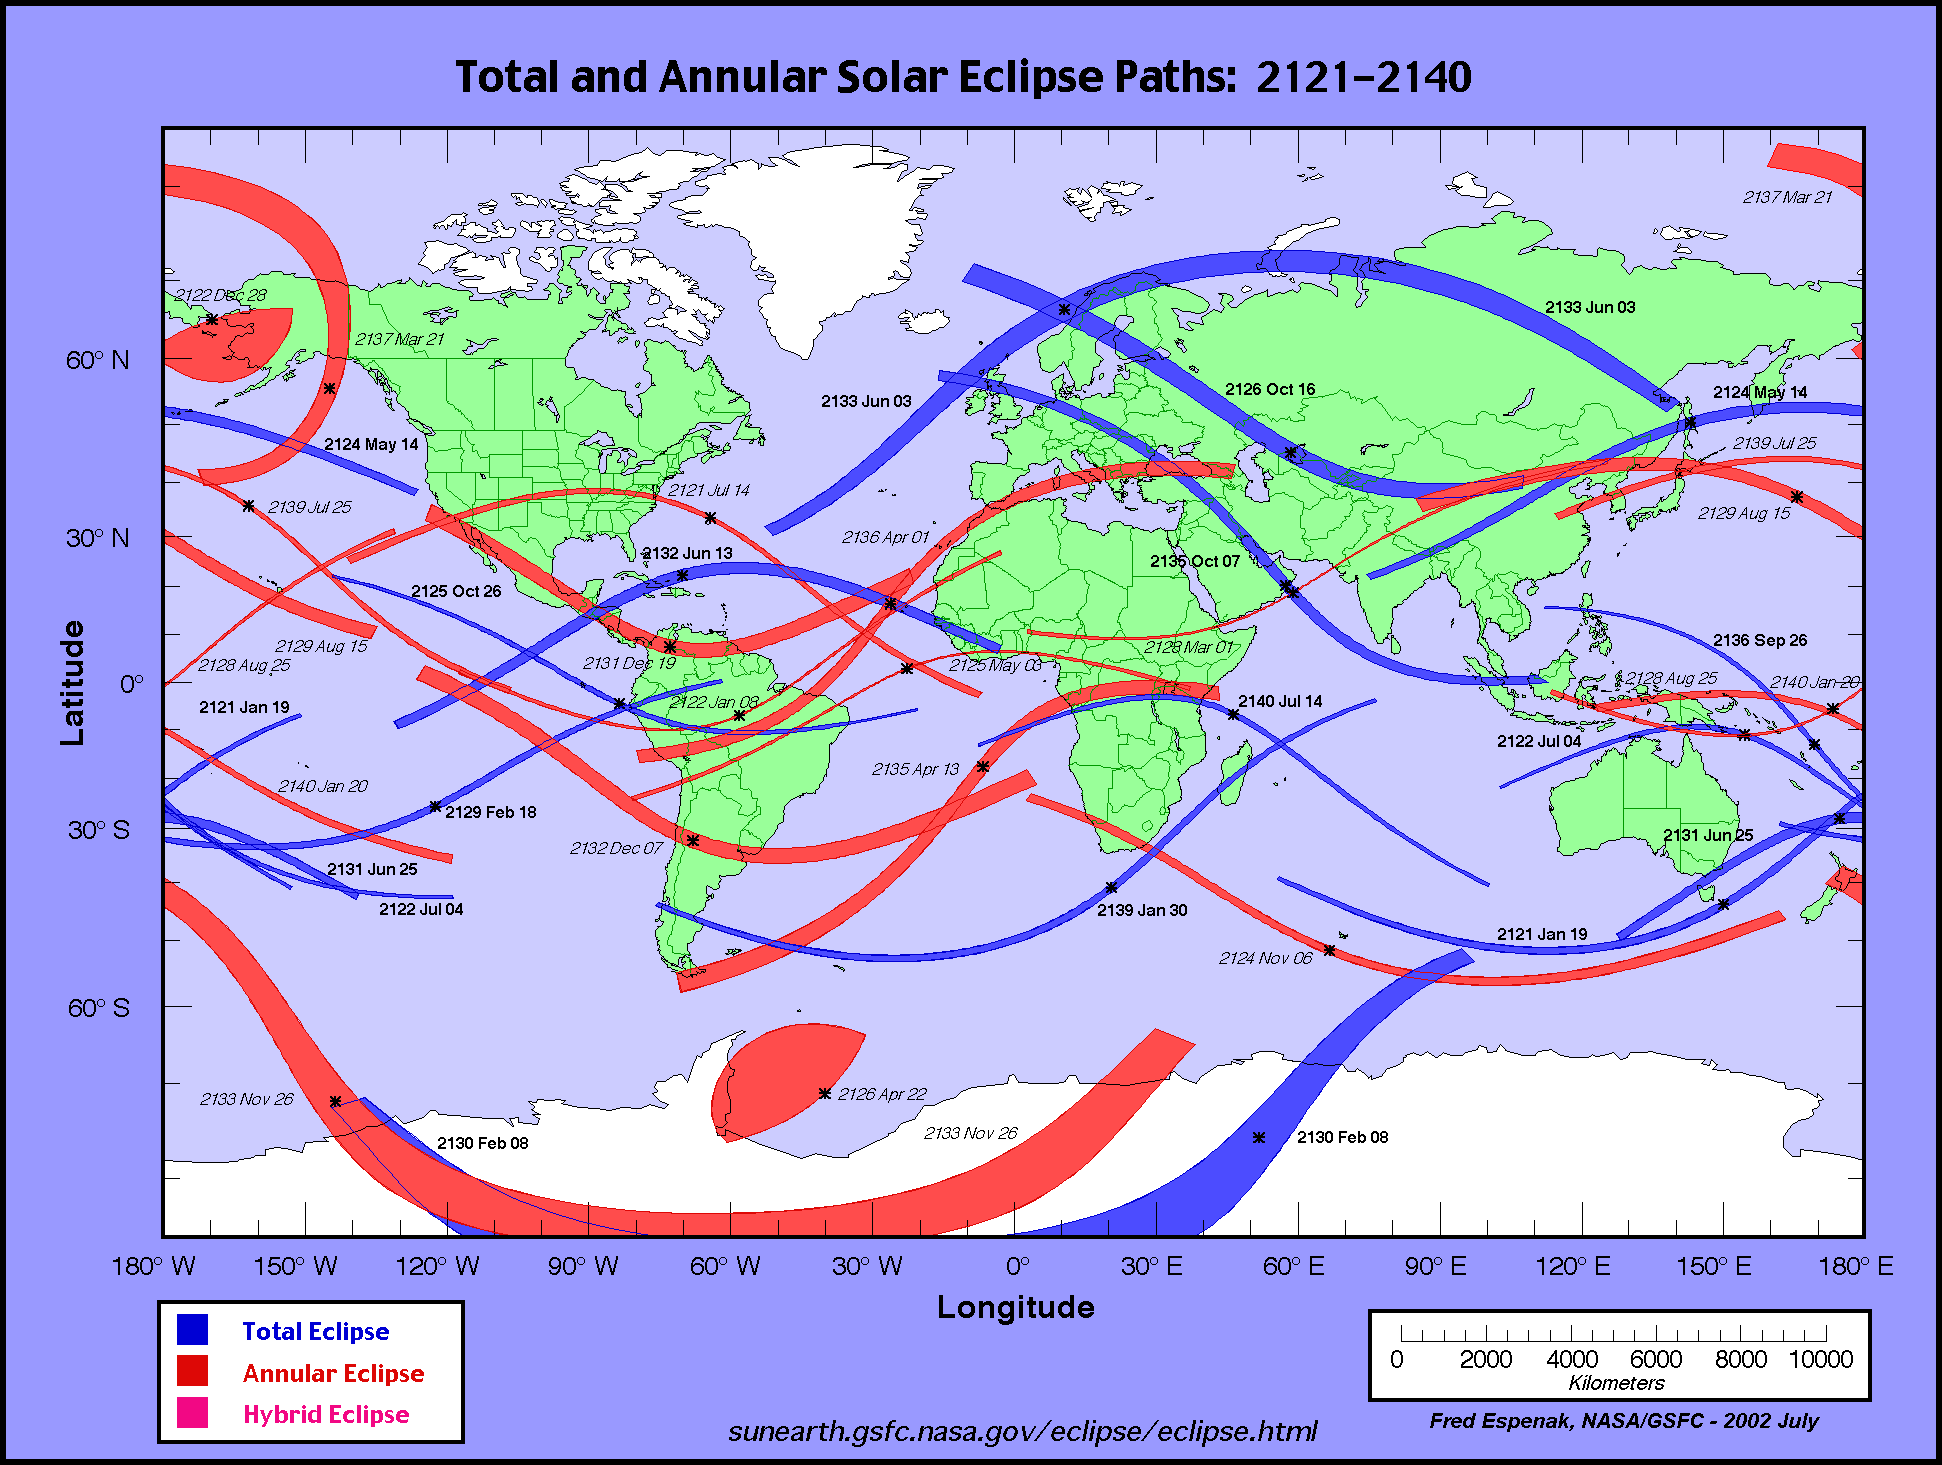
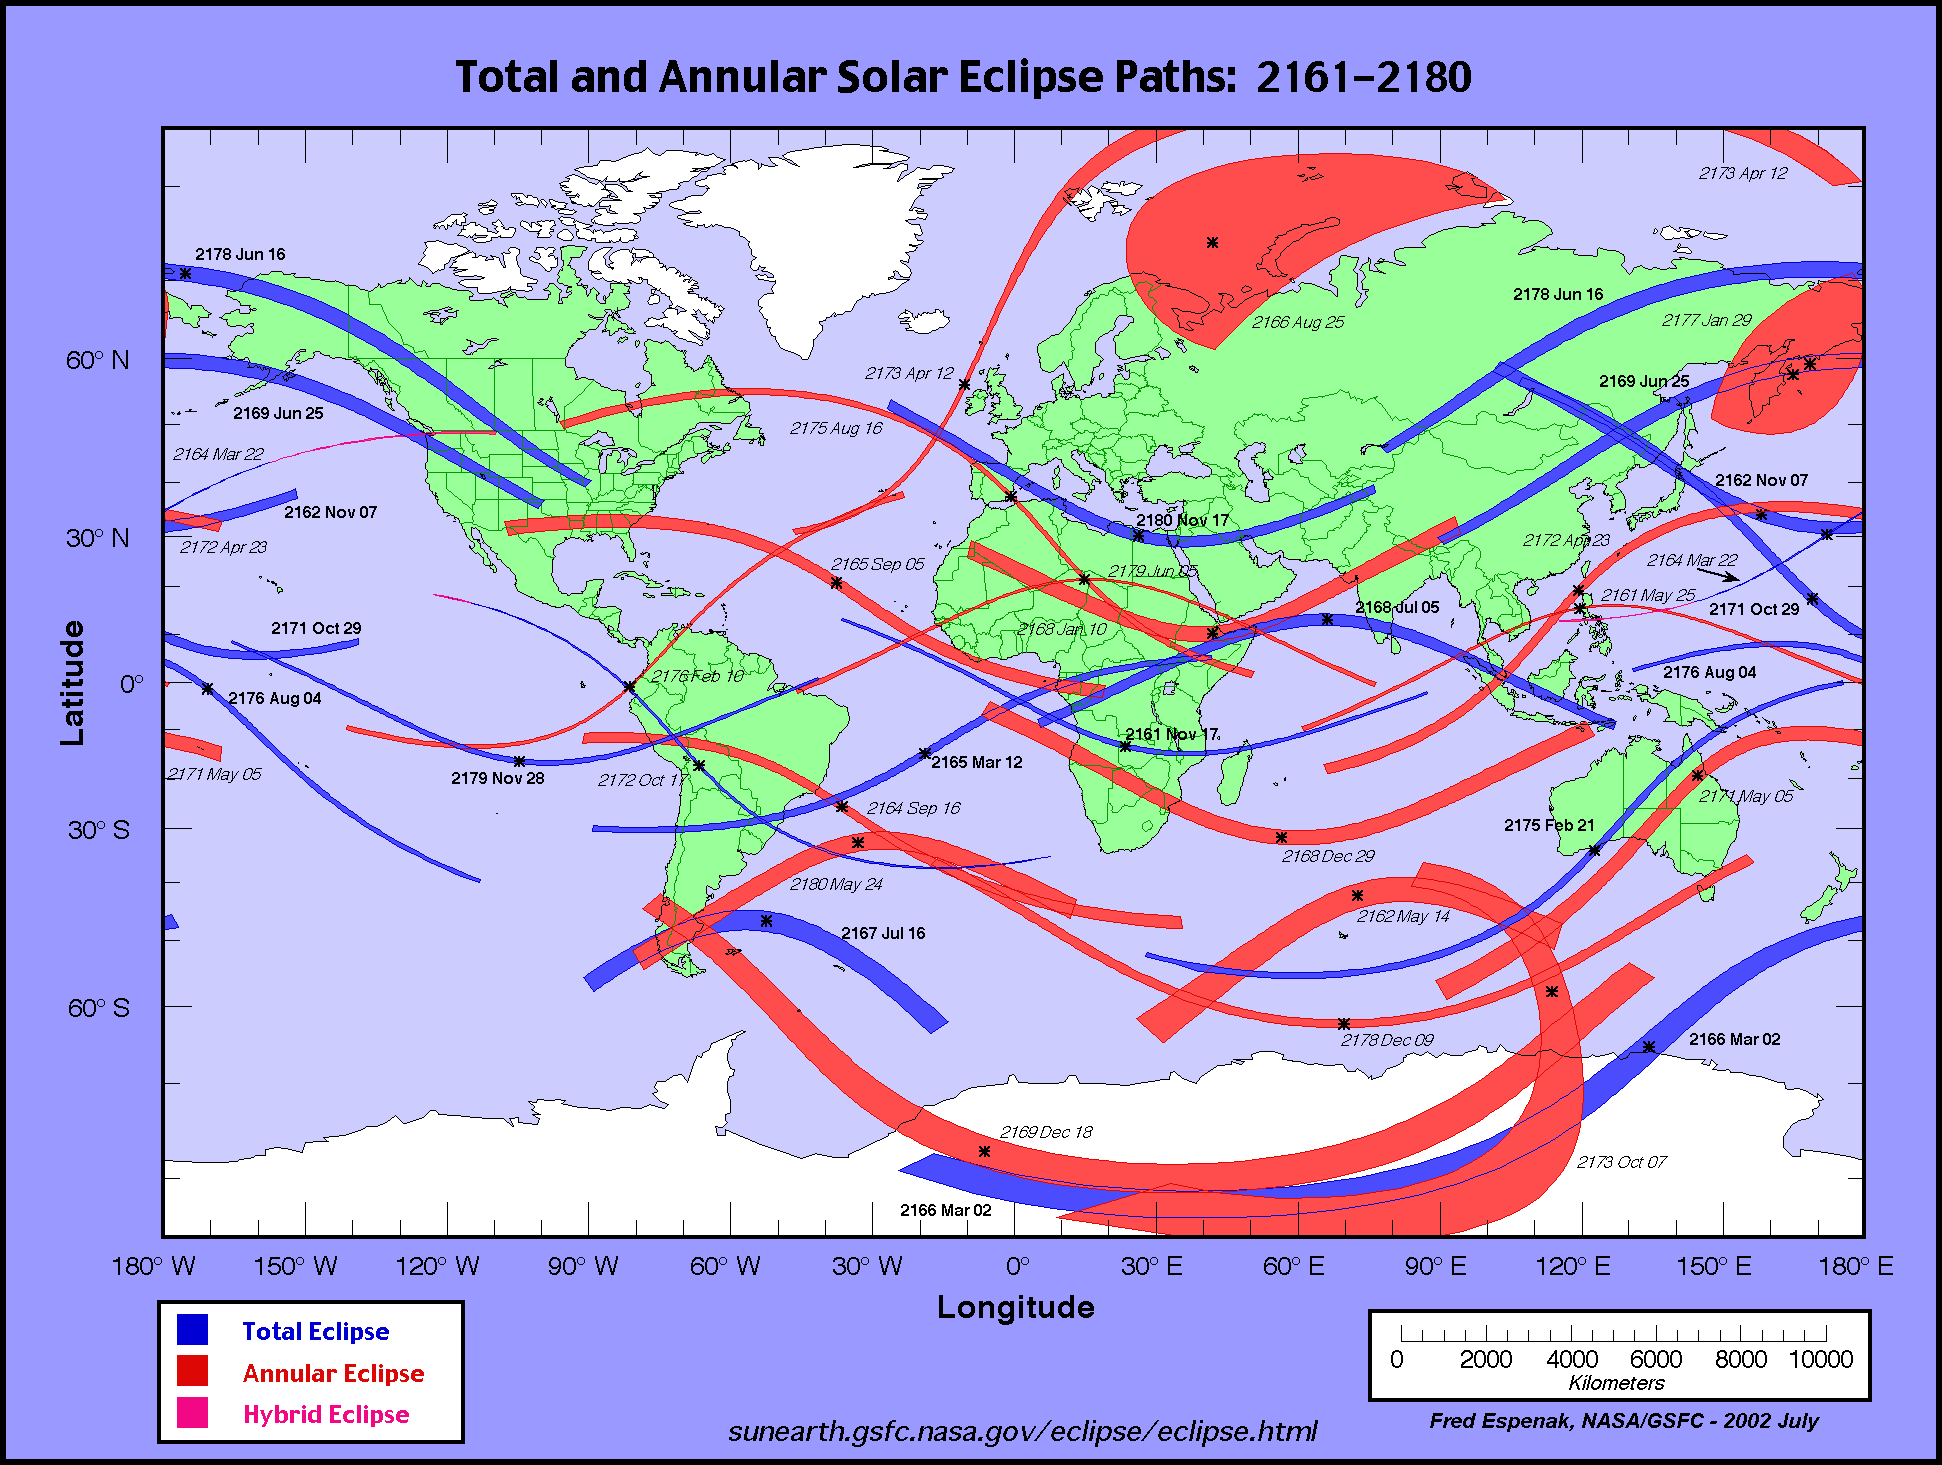
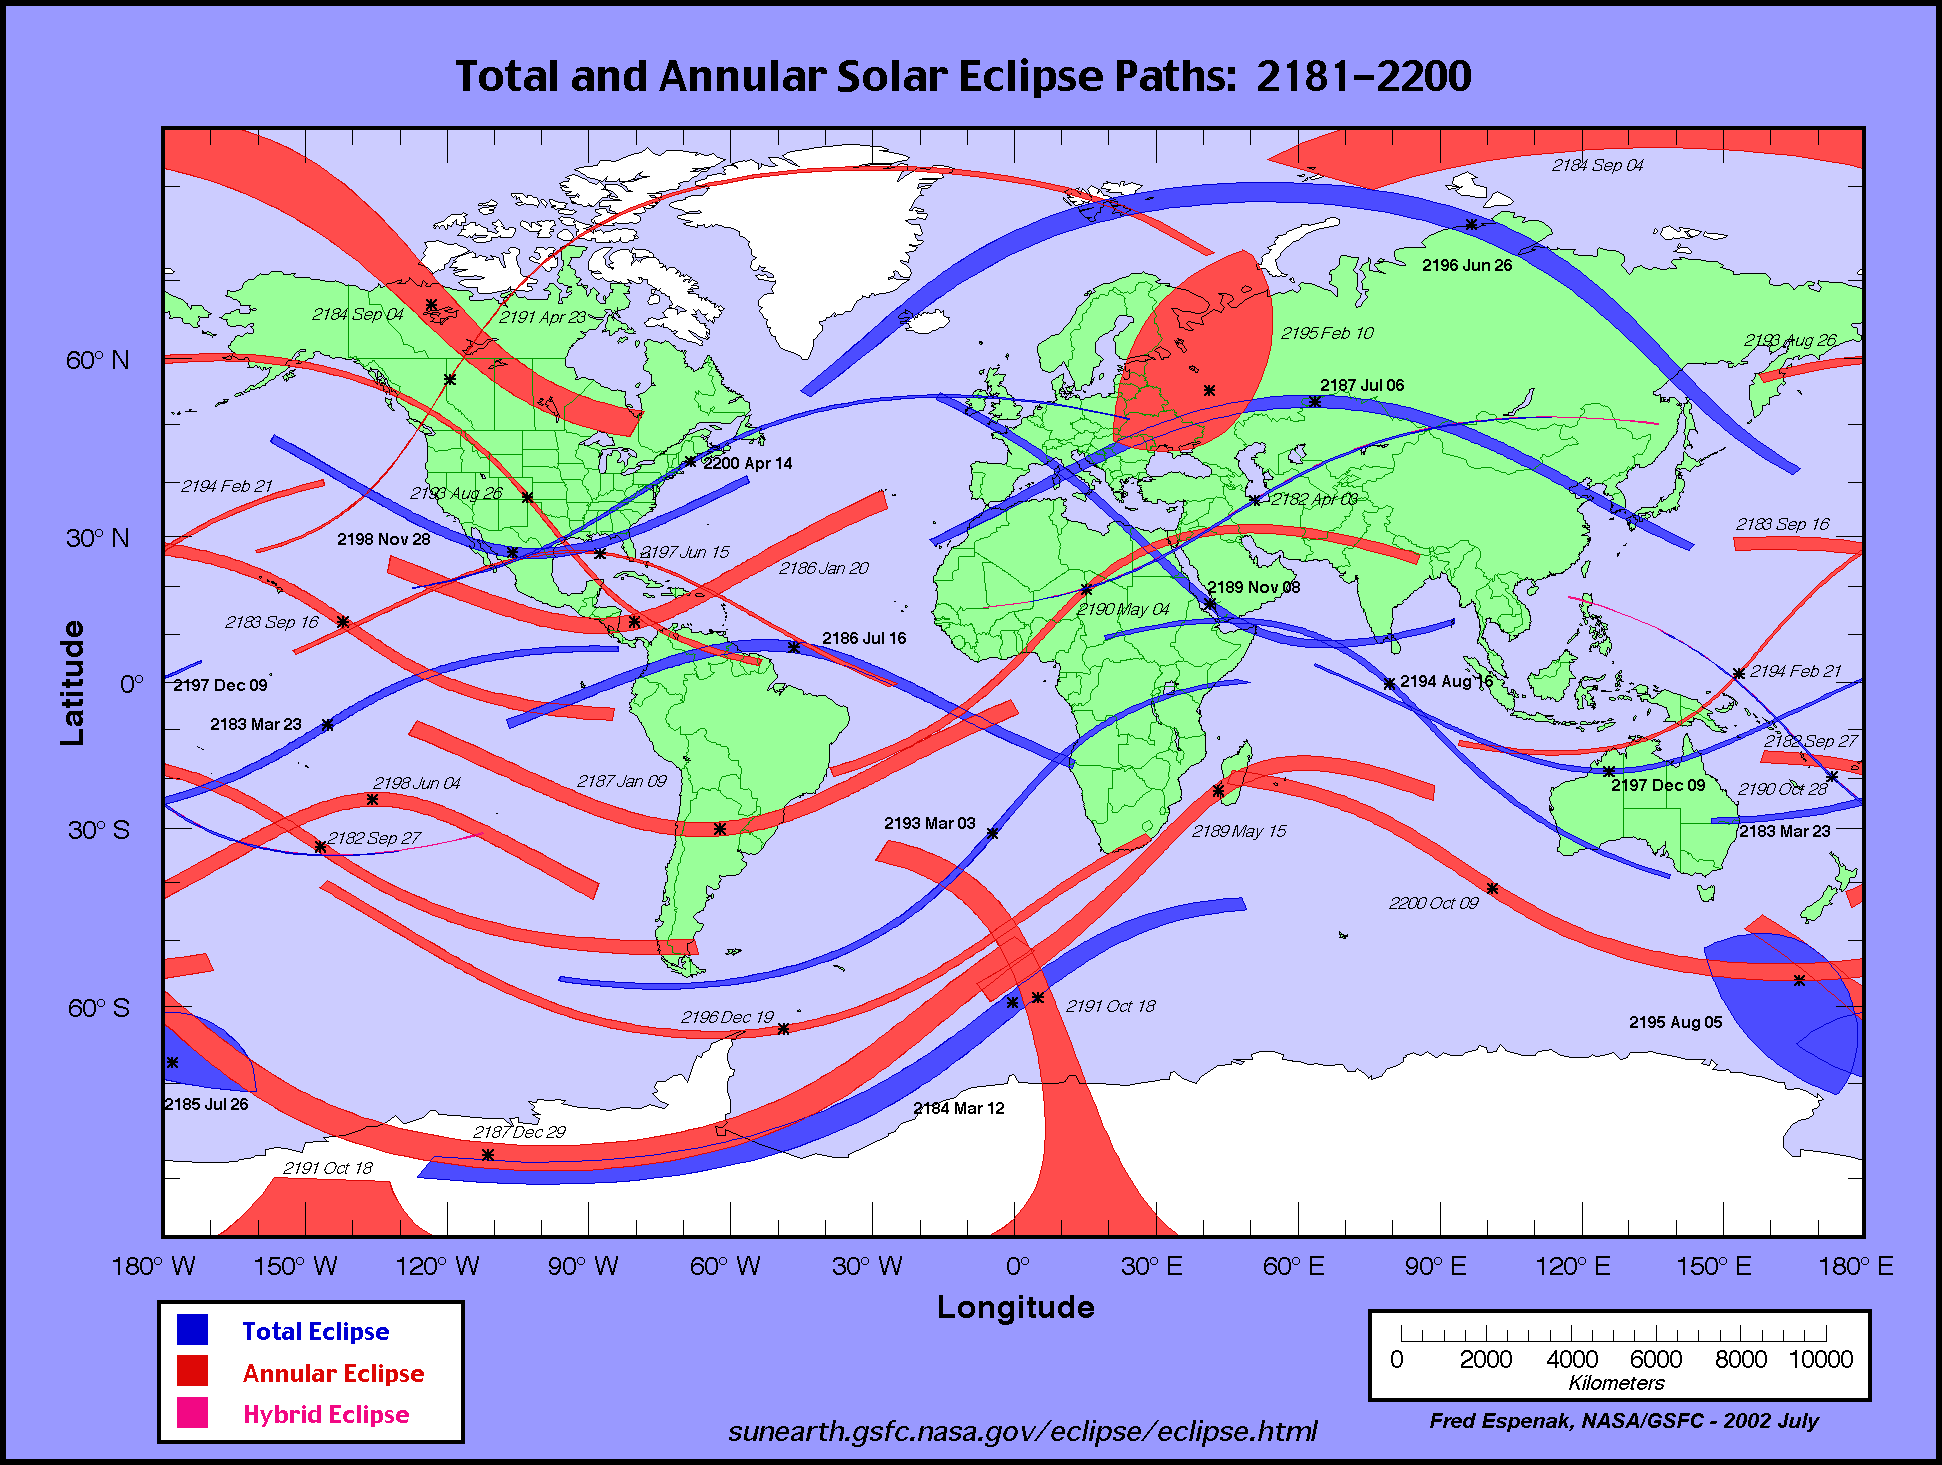
| 22nd Century | 2101-2120 | 2121-2140 | 2141-2160 | 2161-2180 | 2181-2200 |
For eclipse maps covering other centuries/decades, see World Atlas of Solar Eclipse Paths.
Links to Additional Solar Eclipse Predictions
- Home - home page of EclipseWise with predictions for both solar and lunar eclipses
- Solar Eclipses - primary page for solar eclipse predictions
- Solar Eclipse Links - detailed directory of links
- Solar Eclipse Basics - a primer on solar eclipses
- Solar Eclipses and the Saros - details on the Saros cycle
- Global Map Animations of Solar Eclipses: 2001 - 2100 - animations of every solar eclipse during the 21st Century
- 21st Century World Atlas of Central Solar Eclipses - covers the years 2001 to 2100
- 21st Century Catalog of Solar Eclipses - covers the years 2001 to 2100
- World Atlas of Solar Eclipse Maps - covers the years -2999 to +3000 (3000 BCE to 3000 CE)
- Central Solar Eclipses in the USA - maps for all central solar eclipses in the USA from 1001 to 3000
- Six Millennium Catalog of Solar Eclipses - including the years -2999 to +3000 (3000 BCE to 3000 CE)
- Catalog of Solar Eclipse Saros Series - including Saros series -30 through 190
- Solar Eclipse Search Engine - search for solar eclipses from -1999 to +3000
- Javascript Solar Eclipse Explorer - calculate all solar eclipses visible from a city
- MrEclipse.com - eclipse resources and tips on photography
- Solar Eclipses for Beginners - a primer on solar eclipse basics
- How to Photograph a Solar Eclipse - instructions for imaging an eclipse of the Sun
- MrEclipse Photo Index - an index of solar eclipse photographs
Solar Eclipse Publications
- Eclipse Almanac: 2021 to 2030 - overview of all solar and lunar eclipses for the decade
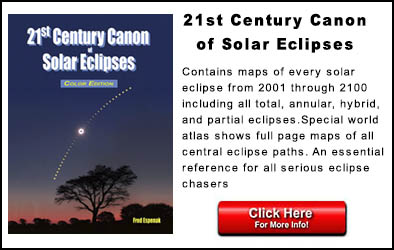
- 21st Century Canon of Solar Eclipses - covers every solar eclipse from 2001 through 2100
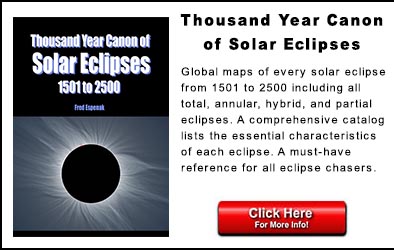
- Thousand Year Canon of Solar Eclipses 1501 to 2500 - basic details about every solar eclipse for 1000 years
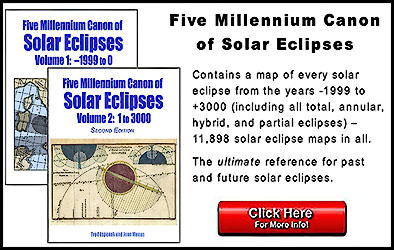
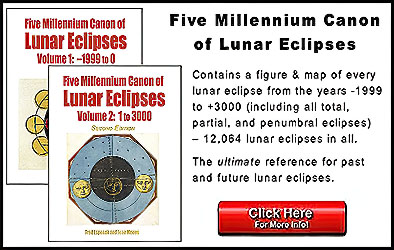
- Five Millennium Canon of Solar Eclipses: -1999 to +3000 - the ultimate reference with maps and diagrams
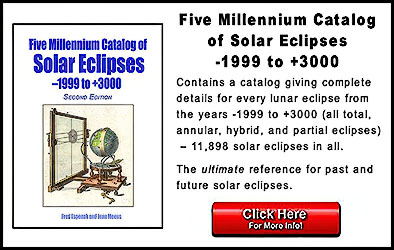
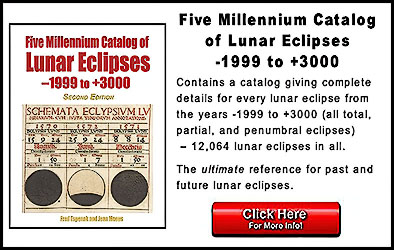
- Five Millennium Catalog of Solar Eclipses: -1999 to +3000 - the ultimate reference containing comprehensive tables
- Atlas of Central Solar Eclipses in the USA - 2,000 years of solar eclipses through North America
- Road Atlas of the Annular Solar Eclipse of 2023 October 14 - detailed maps of the annular eclipse path
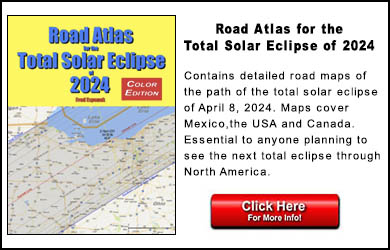
- Road Atlas of the Total Solar Eclipse of 2024 April 08 - detailed maps of the total eclipse path
- Astropixels Publishing - link to more eclipse publications
Eclipse Publications
by Fred Espenak

|

|

|

|
|

|
|

|
|
|
|
|

|
|
|
|
Eclipse Predictions
The eclipse predictions presented here were generated using the JPL DE405 solar and lunar ephemerides. The lunar coordinates have been calculated with respect to the Moon's Center of Mass.
Acknowledgments
Some of the content on this web site is based on the book Thousand Year Canon of Solar Eclipses 1501 to 2500. All eclipse calculations are by Fred Espenak, and he assumes full responsibility for their accuracy.
Permission is granted to reproduce eclipse data when accompanied by a link to this page and an acknowledgment:
"Eclipse Predictions by Fred Espenak, www.EclipseWise.com"
The use of diagrams and maps is permitted provided that they are NOT altered (except for re-sizing) and the embedded credit line is NOT removed or covered.