
Eclipses and the Moon's Orbit
Fred Espenak
| Index |
| 4.1 Introduction |
| 4.2 Synodic Month |
| 4.3 Anomalistic Month |
| 4.4 Draconic Month |
| 4.5 Eclipse Cycles |
4.1 Introduction
The Moon revolves around Earth in an elliptical orbit with a mean eccentricity of 0.0549. Thus, the Moon's center-to-center distance from Earth varies with mean values of 363,396 km at perigee to 405,504 km at apogee. The lunar orbital period with respect to the stars (sidereal month) is 27.32166 days (27d 07h 43m 12s). However, there are three other orbital periods or months that are crucial to the understanding and prediction of eclipses. These three cycles and the harmonics between them determine when, where, and how solar and lunar eclipses occur.
The mutual gravitational force between the Sun and Moon is over twice as large as between the Moon and Earth. For this reason, the Sun plays a dominant role in perturbing the Moon's motion. The ever changing distances and relative positions between the Sun, Moon, and Earth, the inclination of the Moon's orbit, the oblateness of Earth, and (to a lesser extent) the gravitational attraction of the other planets all act to throw the Moon's orbital parameters into a constant state of change. Although the Moon's position and velocity can be described by the classic Keplerian orbital elements, such osculating elements are only valid for a single instant in time (Chapront-Touze' and Chapront, 1991). Nevertheless, these instantaneous parameters are of value in understanding the Moon's complex motions particularly with respect to the three major orbital cycles that govern eclipses.
4.2 Synodic Month
The most familiar lunar cycle is the synodic month because it governs the well-known cycle of the Moon's phases. The Moon has no light of its own but shines by reflected sunlight. As a consequence, the geometry of its orbital position relative to the Sun and Earth determines the Moon's apparent phase.
The mean length of the synodic month is 29.53059 days (29d 12h 44m 03s). This is nearly 2.21 days longer than the sidereal month. As the Moon revolves around Earth, both objects also progress in orbit around the Sun. After completing one revolution with respect to the stars, the Moon must continue a little farther along its orbit to catch up to the same position it started from relative to the Sun and Earth. This explains why the mean synodic month is longer than the sidereal month.
According to astronomical convention, New Moon is defined as the instant when the geocentric ecliptic longitudes of the Sun and Moon are equal. When the synodic month is measured from New Moon to New Moon, it is sometimes referred to as a lunation, and we will follow that usage here. Historically, the phases of the Moon have been used as the basis of lunar calendars by many cultures around the world. The major problem with such calendars is that the year, based on the solar calendar, is not evenly divisible by a whole number of lunations. Consequently, most lunar calendars are actually lunisolar calendars (e.g., Chinese, Hebrew, and Hindu) that include intercalary months to keep the seasons in step with the year.
The duration of the lunation actually varies from its mean value by up to seven hours. For instance, Table 4-1 contains details for all lunations in 2008. The first column lists the decimal date of every New Moon throughout the year (Terrestrial Dynamical Time), while the second column gives the duration of each lunation. The third column is the difference between the actual and mean lunation. The first lunation of the year (Jan 08) was 03h 23m longer than the mean. Continuing through 2008, the length of each lunation drops and reaches a minimum of 05h 48m shorter than the mean value (Jun 03). The duration now increases with each succeeding lunation until the maximum value of the year is reached of 06h 49m longer than the mean (Dec 27).
| Table 4-1 New Moon and Lunation Length in 2008 | |||
| Date of New Moon (Dynamical Time) |
Length of Lunation |
Difference From Mean Lunation |
Moon's True Anomaly |
| 2008 Jan 08.4849 | 29d 16h 07m | +03h 23m | 242.4° |
| 2008 Feb 07.1567 | 29d 13h 30m | +00h 46m | 280.0° |
| 2008 Mar 07.7190 | 29d 10h 41m | -02h 03m | 310.8° |
| 2008 Apr 06.1642 | 29d 08h 23m | -04h 21m | 332.7° |
| 2008 May 05.5134 | 29d 07h 04m | -05h 40m | 349.4° |
| 2008 Jun 03.8081 | 29d 06h 56m | -05h 48m | 4.4° |
| 2008 Jul 03.0970 | 29d 07h 54m | -04h 50m | 20.1° |
| 2008 Aug 01.4261 | 29d 09h 45m | -02h 59m | 39.2° |
| 2008 Aug 30.8327 | 29d 12h 14m | -00h 30m | 64.9° |
| 2008 Sep 29.3426 | 29d 15h 02m | +02h 18m | 98.7° |
| 2008 Oct 28.9687 | 29d 17h 41m | +04h 57m | 133.4° |
| 2008 Nov 27.7053 | 29d 19h 28m | +06h 44m | 161.9° |
| 2008 Dec 27.5163 | 29d 19h 33m | +06h 49m | 186.6° |
What is the cause of this odd behavior? The last column in Table 4-1 gives a clue; it contains the Moon's true anomaly at the instant of New Moon. The true anomaly is the angle between the Moon's position and the point of perigee along its orbit. In other words, it is the orbital longitude of the Moon with respect to perigee. Table 4-1 shows that when New Moon occurs near perigee (true anomaly = 0°), the length of the lunation is at a minimum (e.g., Jun 03). Similarly, when New Moon occurs near apogee (true anomaly = 180°), the length of the lunation reaches a maximum (e.g., Dec 27).
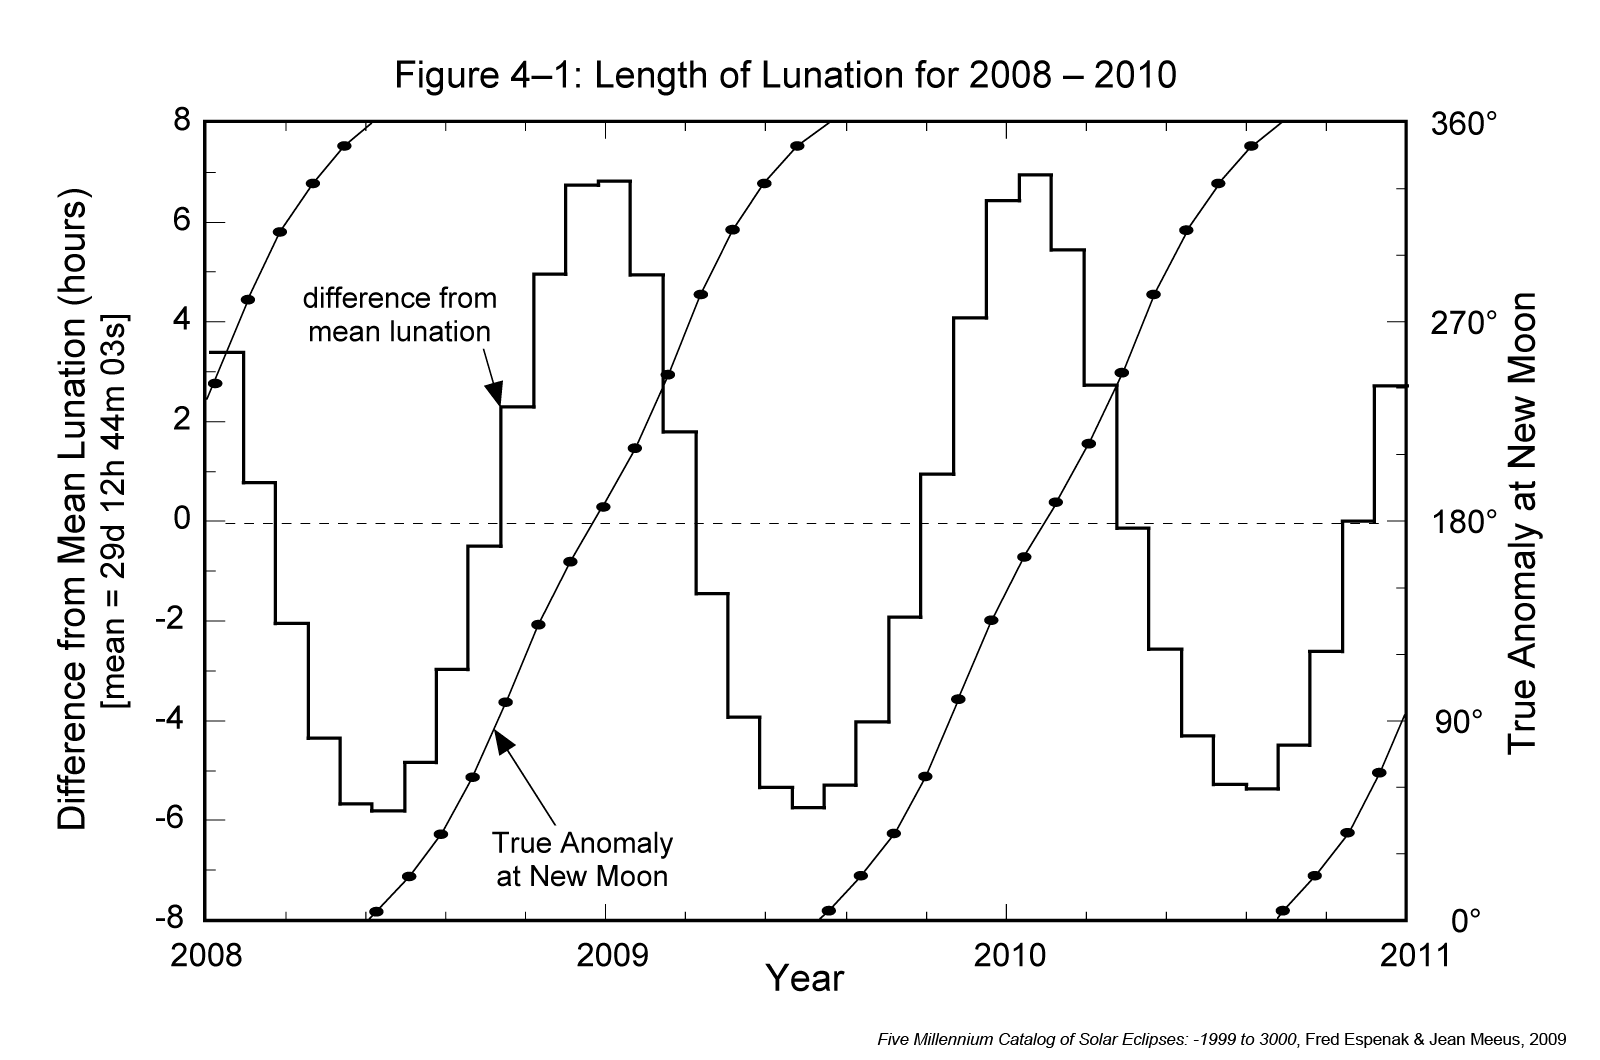
This relationship is quite apparent when viewed graphically. Figure 4-1 plots the difference from mean lunation (histogram) and the Moon's true anomaly (diagonal curves) for every New Moon from 2008 through 2010. The left-hand scale is for the difference from mean lunation, while the right-hand scale is for the true anomaly. The shortest lunations are clearly correlated with New Moon at perigee, while the longest lunations occur at apogee. From the figure, the length of this cycle appears to be about 412 days. The reason why must wait until the next section.
The Moon's orbital period with respect to perigee is the anomalistic month and has a duration of approximately 27.55 days. The lock-step rhythm between the lunation length and true anomaly can be explained with the help of the anomalistic month and Figure 4-2. It illustrates the Moon's orbit around Earth and Earth's orbit around the Sun. The relative sizes and distances of the Sun, Moon, and Earth as well as the eccentricity of the Moon's orbit are all exaggerated for clarity. The major axis of the Moon's orbit marks the positions of perigee and apogee.
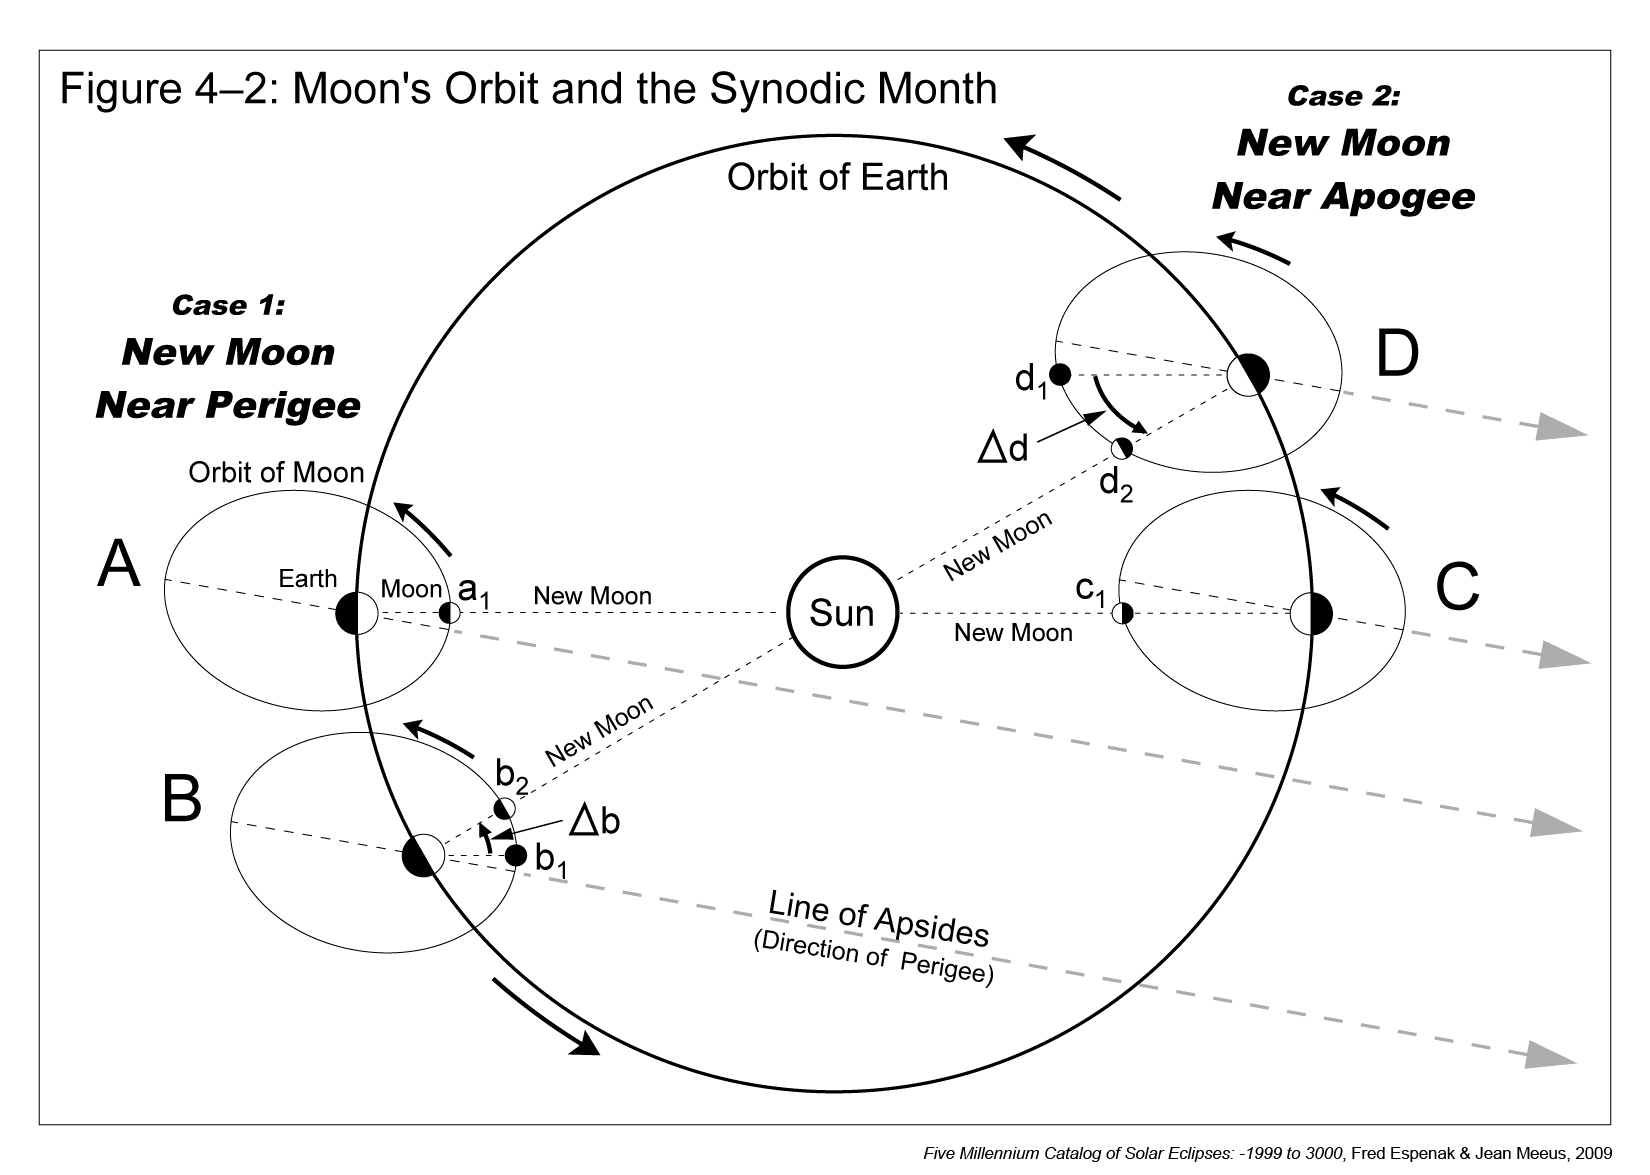
Two distinct cases-each consisting of two revolutions of the Moon around Earth-are depicted in Figure 4-2. The first case covers the New Moon geometry around perigee. The orbit marked A shows New Moon taking place near perigee at position a1. One anomalistic month later (orbit B), the Moon has returned to the same position relative to perigee (marked b1). However, Earth has traveled about 30° around its orbit so the Sun's direction relative to the Moon's major axis has shifted. The Moon must travel an additional distance of Δb in its orbit before reaching the New Moon phase at b2. This graphically demonstrates why the synodic month is longer (~1.98 days) than the anomalistic month.
The second case takes place about half a year later. New Moon then occurs near apogee (orbit C, position c1). After one anomalistic month, the Moon has returned to the same location with respect to apogee (orbit D, position d1). Once again, Earth has traveled about 30° around its orbit so the Moon must revolve an additional distance of Δd before reaching the New Moon phase at position d2.
An inspection of orbits B and D reveals that the orbital arc Δd is longer that Δb. This means that the Moon must cover a greater orbital distance to reach New Moon near apogee as compared to perigee. Furthermore, the Moon's orbital velocity is slower at apogee so it takes longer to travel a given distance. Thus, the length of the lunation is shorter than average when New Moon occurs near perigee and longer than average when New Moon occurs near apogee. Earth's elliptical orbit around the Sun also factors into the length of the lunation. With an eccentricity of 0.0167, Earth's orbit is about one third as elliptical as the Moon's orbit. Nevertheless, it affects the length of the lunation by producing shorter lunations near aphelion and longer lunations near perihelion.
During the 5000-year period covered in this catalog, there are 61841 complete lunations. The shortest lunation began on -1602 Jun 03 and lasted 29.26574 days (29d 06h 22m 40s; 6h 21m 23s shorter than the mean). The longest lunation began on -1868 Nov 27 and lasted 29.84089 days (29d 20h 10m 53s; 7h 26m 50s longer than the mean). Thus, the duration of the lunation varies over a range of 13h 48m 13s during this time interval.
The histogram presented in Figure 4-3 shows the distribution in the length of the lunation over 5000 years. To create the histogram, the durations of individual lunations were binned into 30-minute groups. It might seem reasonable to expect a simple bell-shaped Gaussian curve. However, the results are surprising because the distribution in lunation length has two distinct peaks. This bifurcation can be understood if the lunation length, which depends primarily on the Moon's distance, is considered as a series of sine functions. The extremes of a sine function always occur more frequently than the mean, which is just what is seen in Figure 4-3. For a more detailed discussion, see Meeus (1997).

4.3 Anomalistic Month
The anomalistic month is defined as the revolution of the Moon around its elliptical orbit as measured from perigee to perigee. The length of this period can vary by several days from its mean value of 27.55455 days (27d 13h 18m 33s). Figure 4-4 plots the difference of the anomalistic month from the mean value for the 3-year interval 2008 through 2010. Also plotted is the difference between the mean longitudes of the Sun and perigee. This is just the angle between the Sun and the Moon's major axis in the direction of perigee. The left-hand scale is the length of the anomalistic month minus the mean value, while the right-hand scale is for the difference in longitude (Sun-perigee). For comparison, the lunation length minus its mean value is also plotted (light gray).
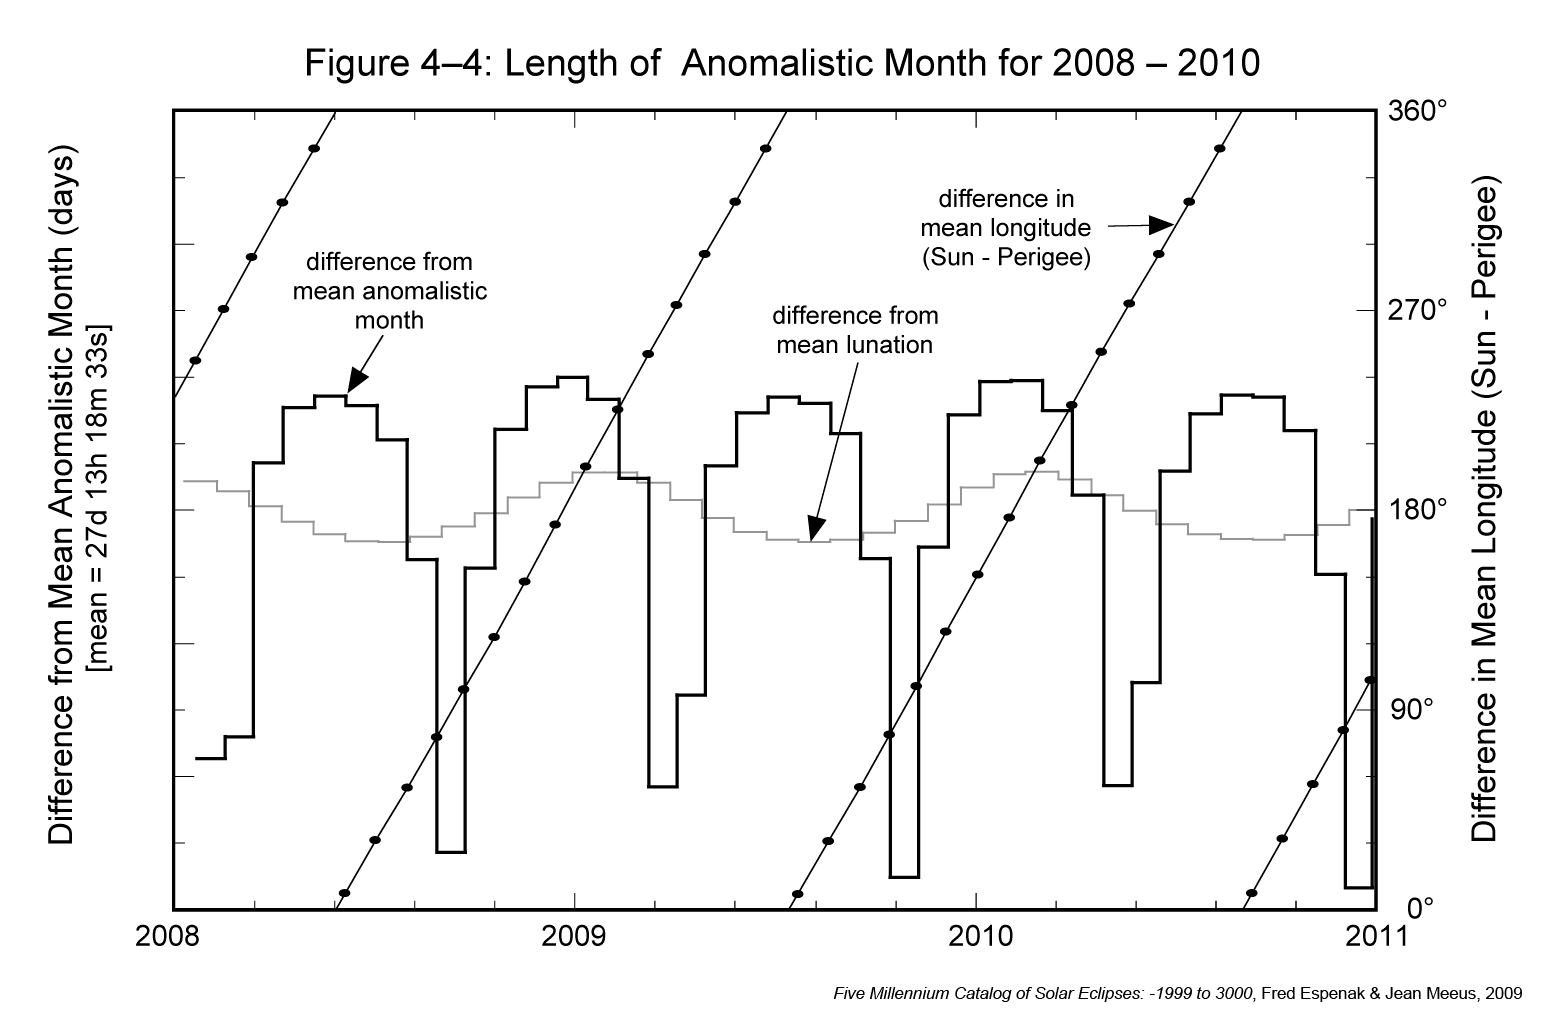
The variation in the length of the anomalistic month is much larger than that of the lunation. Figure 4-4 shows the anomalistic month is typically within 1 day of its mean value. But once or twice every 7 to 8 months, the anomalistic month is significantly shorter than the mean by 2 to nearly 3 days. The difference in longitude of the Sun and perigee show that the shortest anomalistic months are correlated with values of 90° and 270°, when the line of apsides is perpendicular to the Sun's direction.
In comparison, the longest anomalistic months take place when the difference in longitude passes through 0° or 180°. The line of apsides is then directed towards or away from the Sun. The maximum duration of the anomalistic month is then about 28.5 days (1.0 day longer than the mean). The Earth-Sun distance also influences the anomalistic month by causing greater extremes near perihelion. This currently occurs in early January each year.
In an earlier discussion on the synodic month, it was assumed that the lunar orbit's line of apsides has a fixed and permanent direction in space. In fact, the length of the mean anomalistic month (27.55 days) exceeds the mean sidereal month (27.32 days) by 0.23 days. Thus, the Moon's major axis slowly shifts with a mean rate of 0.11140° per day in the direct sense, that is, in the same direction as the Moon's orbital motion. This corresponds to an average of 40.7° per year, so it takes 8.85 years (3231.6 days) for the line of apsides to make one complete revolution with respect to the stars.
What impact do the varying length of the anomalistic month and the direct (eastward) rotation of the Moon's elliptical orbit have on the length of the lunation? To answer this, one must first consider Earth's elliptical orbit around the Sun, which has a mean eccentricity of 0.0167. The center-to-center distance between Earth and the Sun varies with mean values of 147,098,074 km at perihelion to 152,097,701 km at aphelion. The direction of Earth's orbital line of apsides also changes but at a rate far slower than the Moon's. Having a direct (eastward) shift with a mean value of 0.0172° per year, it takes about 20,500 years for Earth's major axis to make one complete revolution. This is only 0.0004 of the lunar rate, so it can be treated as fixed for the purpose of the following discussion.
At certain times, the perigee of the lunar orbit and the perihelion of Earth's orbit can have the same ecliptic longitude. Ignoring the 5.1° tilt of the Moon's obit, the major axes are then essentially parallel to each other and point in the same direction. As time passes, the major axis of the lunar orbit slowly rotates east with respect to Earth's major axis until it becomes perpendicular to it 2.21 years later. In another 2.21 years (4.42 years from the start), the major axes of the orbits are again parallel to each other, but the perigee and the perihelion are 180° apart as they point in opposite directions. After an additional period of 2.21 years, the axes are once more perpendicular. Finally, the Moon's perigee and Earth's perihelion again share the same ecliptic longitude after a total interval of 8.85 years.
The length of each lunation minus the mean lunation is plotted in Figure 4-5 for the 20-year period from 2008 through 2027. The periodic rhythm between the lunation length and the true anomaly, as described earlier (via Figure 4-1), can now be seen over the course of two decades. The 412-day mean period of this cycle corresponds to the time between two consecutive alignments of the major axis in the direction of the Sun. It is slightly longer than a year because of the slow eastward shift of the Moon's major axis.
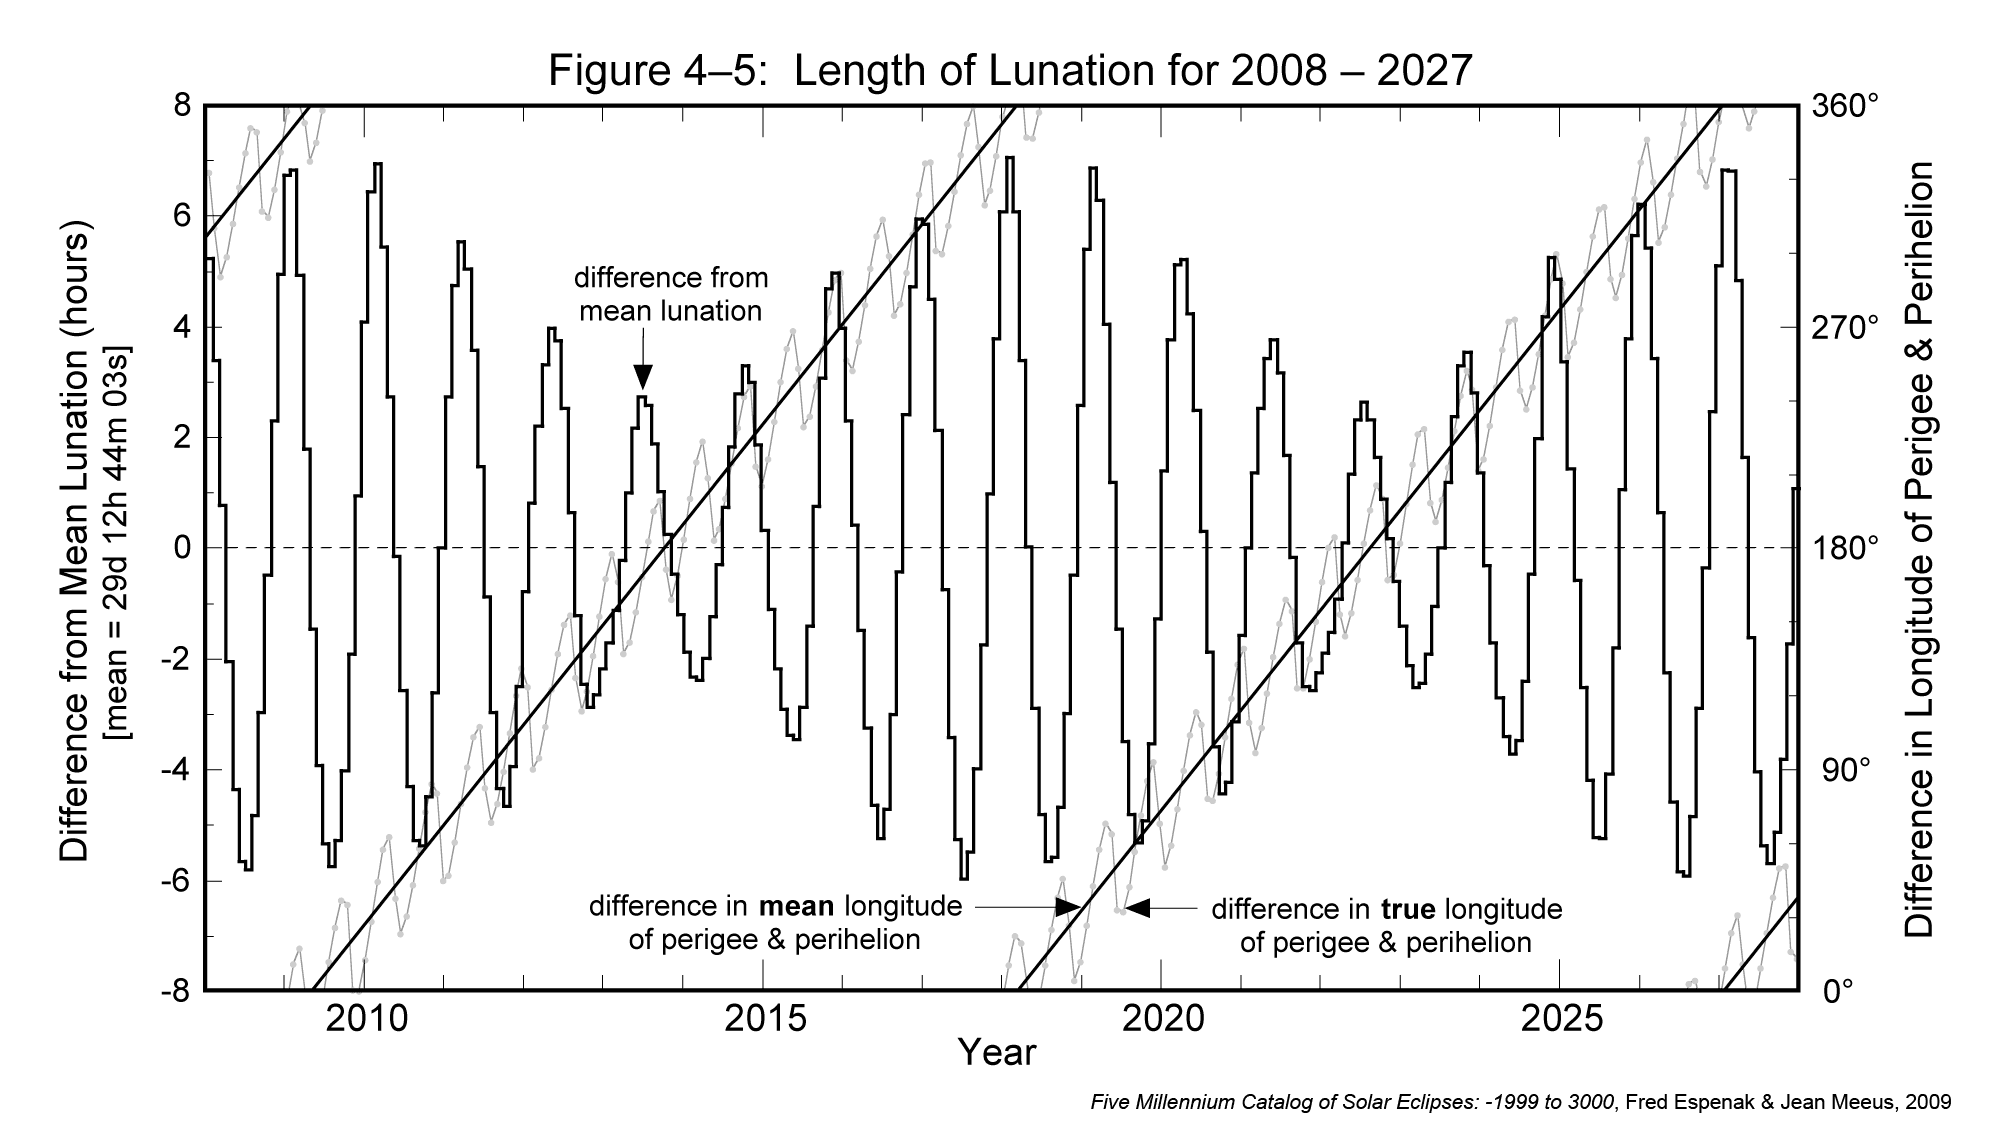
An interesting feature revealed in Figure 4-5 is how the extremes in the lunation length slowly vary over a period of nearly 9 years. The envelope defined by the minima and maxima appears to oscillate over a range of values from ±2 h to ±6 h. This behavior is evidence revealing the influence of the 8.85-year cycle in the alignment of the major axes of the orbits of the Moon and Earth.
The amplitude of the envelope is due to the eccentricity of Earth's orbit. When Earth is at perihelion, its orbital velocity is at its maximum value so Earth travels a larger distance around its orbit in a given time as compared to aphelion. Thus, the Moon must travel a greater distance to align with the Sun, which results in a longer lunation. Near aphelion, the opposite conditions produce a shorter lunation.
Using the axis scale on the right, the diagonal lines in Figure 4-5 plot the angle between the Moon's perigee and Earth's perihelion. This is the difference between the Moon's mean longitude of perigee and Earth's true longitude of perihelion. When the angle between the perigee and perihelion is 0°, the length of the lunation varies from a minimum of 29.273 days (-6.17 hours from mean) to a maximum of 29.820 days (+6.93 hours from mean). Similarly, when the angle between the perigee and perihelion is 180°, the length of the lunation varies from a minimum of 29.452 days (-1.88 hours from mean) to a maximum of 29.628 days (+2.33 hours from mean). To summarize, the greatest extremes in the length of the lunation occur when the longitudes of the Moon's perigee and Earth's perihelion are equal. The smallest extremes in the lunation length occur when their longitudes differ by 180°.
Although the Moon's major axis rotates eastward at a mean rate of 0.1114° per day, the true rate varies considerably. Figure 4-5 illustrates the variation by plotting the difference between the true longitudes of the Moon's perigee and Earth's perihelion. This quasi-sinusoidal oscillation about the difference in the mean longitudes shows peak departures of ±30° from average. Indeed, the Moon's major axis can swing both east and west of its mean value, taking on an actual retrograde shift west during some anomalistic months.
This dynamic behavior is due to the gravitational pull of the Sun on the Moon as it orbits Earth. Consequently, a continuous torque is applied to the lunar orbit in an unsuccessful effort to permanently align the major axis towards the Sun. The annual orbit of the Earth-Moon system around the Sun coupled with the Moon's synodic orbit around Earth mean that the conditions for such a permanent alignment are always changing. The overall effect is to twist and distort the shape and orientation of the Moon's elliptical orbit.
It was stated earlier that the Moon's mean orbital eccentricity is 0.0549, but this too is subject to large changes because of solar perturbations. Figure 4-6 plots the variation in the Moon's orbital eccentricity from 2008 through 2010. The instantaneous eccentricity (light gray curve) oscillates with a period tied to the synodic month and ranges from 0.0266 to 0.0762 over this 3-year interval. Superimposed on the instantaneous eccentricity is the eccentricity at the instant of perigee, which occurs at the beginning of each anomalistic month (heavy black curve). The straight diagonal lines represent the difference between the mean longitudes of the Sun and perigee. In other words, it is the angle between the Moon's perigee-directed major axis and the Sun. Oscillating about this line is the difference between the true longitudes of Sun and perigee. The scale for these angles appears along the right side of Figure 4-6. The extreme range of the Moon's orbital eccentricity at perigee during the 5000 years covered by the catalog is 0.0255 to 0.0775.
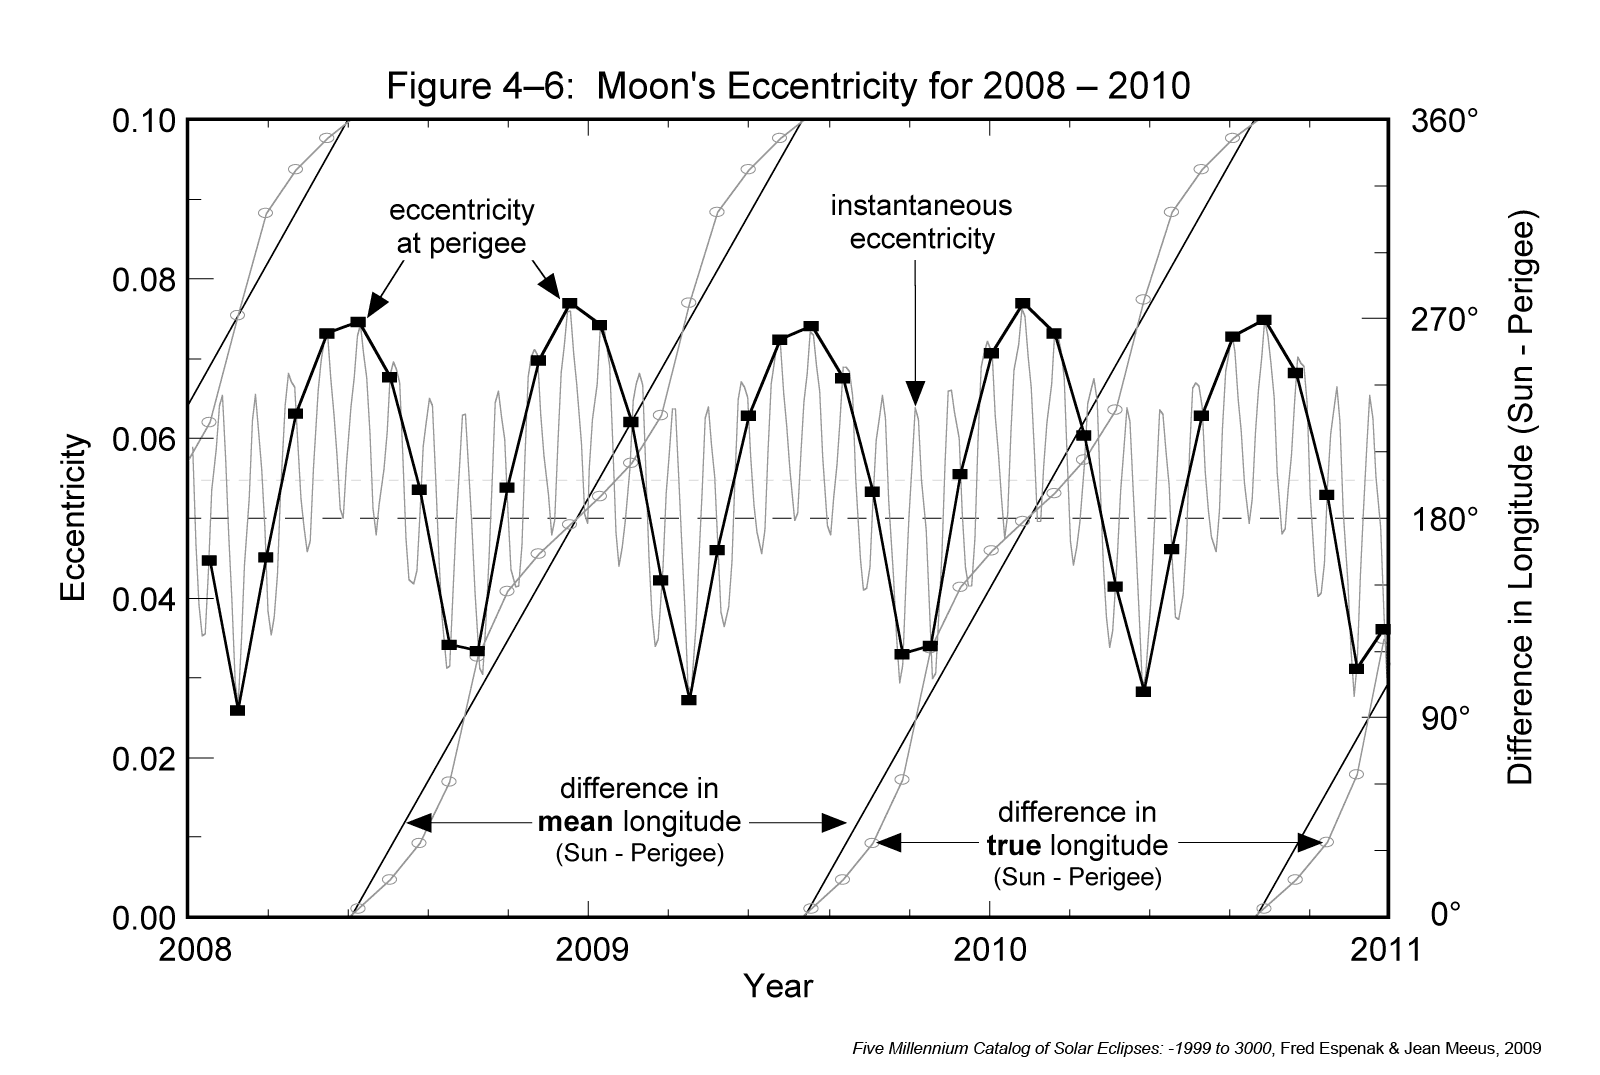
Figure 4-6 shows that the eccentricity reaches a maximum when the major axis of the lunar orbit is pointed directly towards or directly away from the Sun (angles of 0° and 180°, respectively). This occurs at a mean interval of 205.9 days, which is somewhat longer than half a year because of the eastward shift of the major axis. The eccentricity reaches a minimum when the major axis of the lunar orbit is perpendicular to the Sun (angles of 90° and 270°).
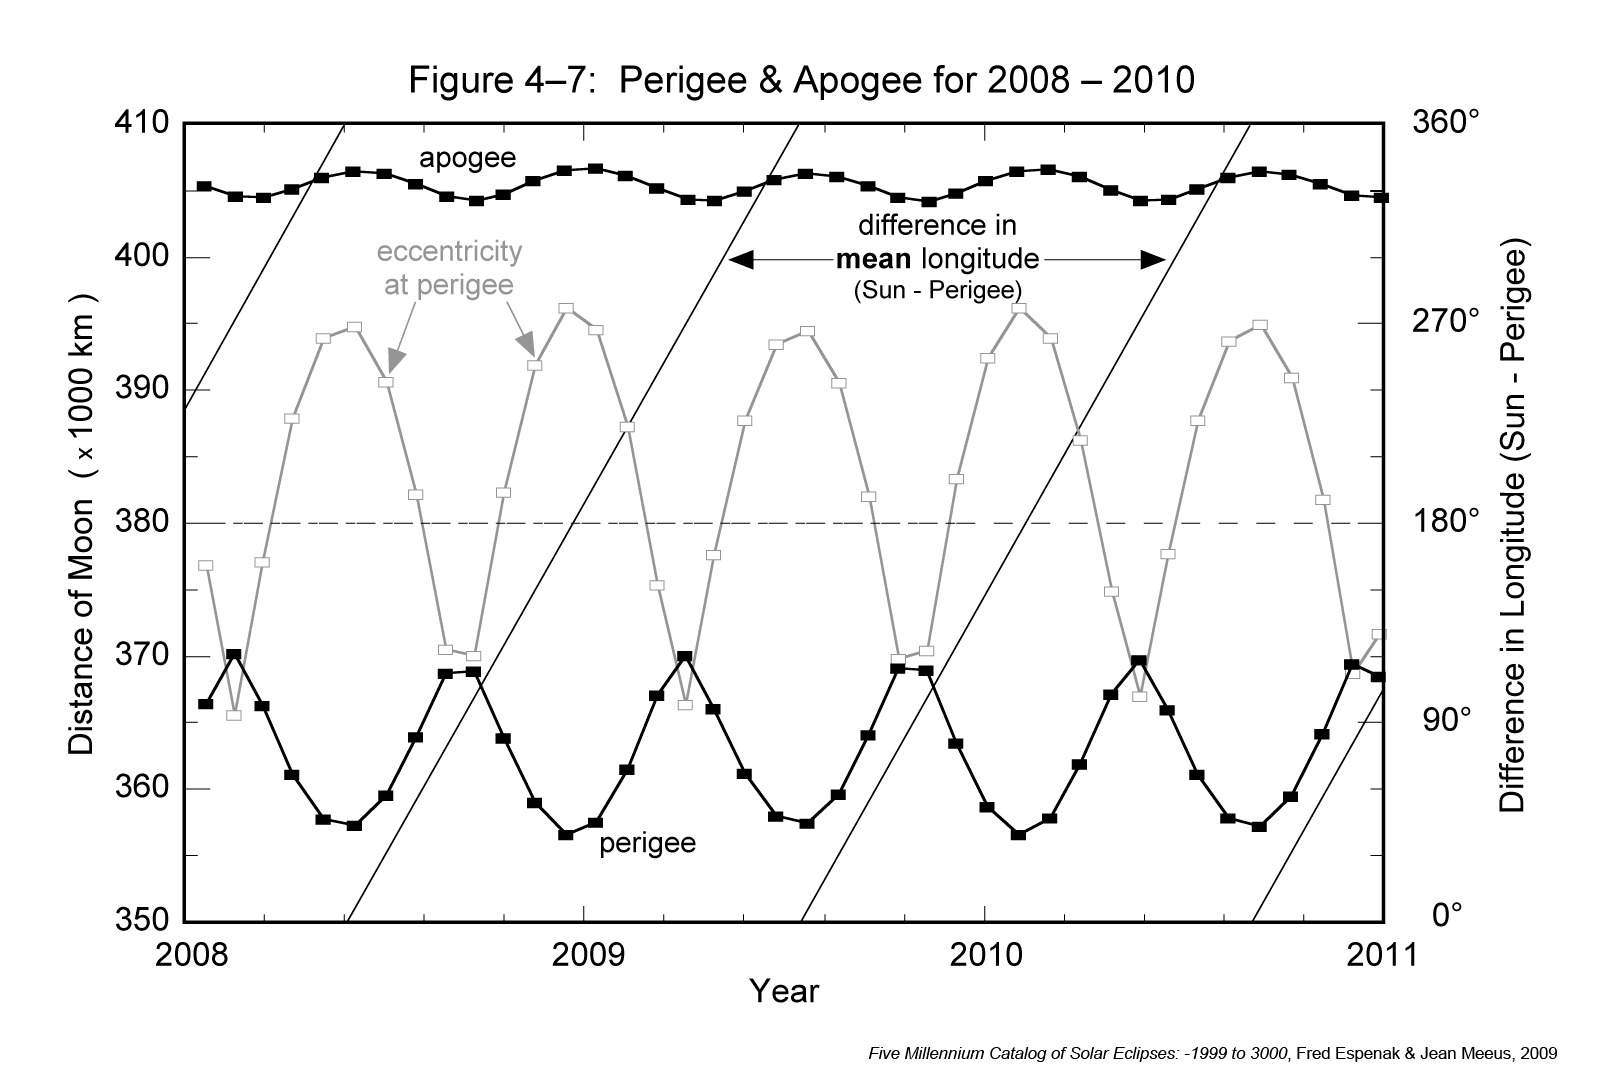
Such changes in orbital eccentricity produce significant variations in the Moon's distance at perigee and apogee. Figure 4-7 plots the Moon's distance for all perigees and apogees from 2008 through 2010. Also shown is the orbital eccentricity at perigee as well as the angle between the perigee directed major axis and the Sun. The closest perigee (minimum perigee distance) and farthest apogee (maximum apogee distance) occur when the eccentricity is at maximum. This corresponds to times when the Moon's major axis points directly towards or directly away from the Sun (angles of 0° and 180°, respectively). The farthest perigee (maximum perigee distance) and closest apogee (minimum apogee distance) occur when the eccentricity is at minimum. At such times, the major axis is oriented perpendicular to the Sun. During the 3-year interval covered in Figure 4-7, the Moon's perigee distance ranges from 356,568 to 370,216 km while the apogee distance ranges from 404,168 to 406,602 km.
Over the 5000-year period of the catalog, there are 66,276 perigees and apogees. During this epoch, the distance of the Moon's perigee varies from 356,355 to 370,399 km while the apogee varies from 404,042 to 406,725 km. The minimum and maximum extremes in orbital eccentricity are 0.0255 to 0.0775 and the extremes in the length of the anomalistic month are 24.629 days (2.925 days shorter than the mean) to 28.565 days (1.011 days longer than the mean). A histogram showing the distribution in the length of the anomalistic month is presented in Figure 4-8 where the durations of individual anomalistic months have been binned into 2-hour groups. The sharply asymmetric distribution shows that anomalistic months longer than the mean cluster over a much shorter range of values compared to anomalistic months shorter than the mean.

4.4 Draconic Month
The plane of the Moon's orbit is inclined at a mean angle of 5.145° to the plane of Earth's orbit around the Sun. The intersection of these planes defines two points or nodes on the celestial sphere. The node where the Moon's path crosses the ecliptic from south to north is the ascending node, while the node where the Moon's path crosses the ecliptic from north to south is the descending node. The draconic month is defined as one revolution of the Moon about its orbit with respect to the ascending node. The mean length of this nodical period is 27.21222 days (27d 05h 05m 36s). However, the actual duration can vary by over 6 h from the mean. Figure 4-9 plots the duration of the draconic month minus its mean value for 2008 through 2010. The shortest month over this 3-year period is 27.05115 days (27d 01h 14m), while the longest month is 27.38409 days (27d 09h 13m).

The most significant characteristic of this variation is that it is synchronized with the ascending node relative to the Sun's position along the ecliptic. The mean angle between the Sun and the ascending node (i.e., difference in mean longitude) is also plotted in Figure 4-9 (diagonal lines) to illustrate this relationship. The longitude difference at the start of each draconic month is plotted as a black dot. Longitude values can be read using the scale along the right side of the figure. The longest draconic months occur when the difference in the mean longitudes of the Sun and the ascending node is either 0° or 180°. In contrast, the shortest months occur when the angle between the Sun and the ascending node is either 90° or 270°.
The mean draconic month is 0.10944 day (2h 36m 36s) shorter than the sidereal month. Consequently, the lunar nodes slowly rotate west or retrograde (opposite the Moon's orbital motion) along the ecliptic at a rate of 0.05295° per day. One complete rotation of the ascending node about the ecliptic requires 18.6 years (6793.48 days) with respect to the fixed stars.
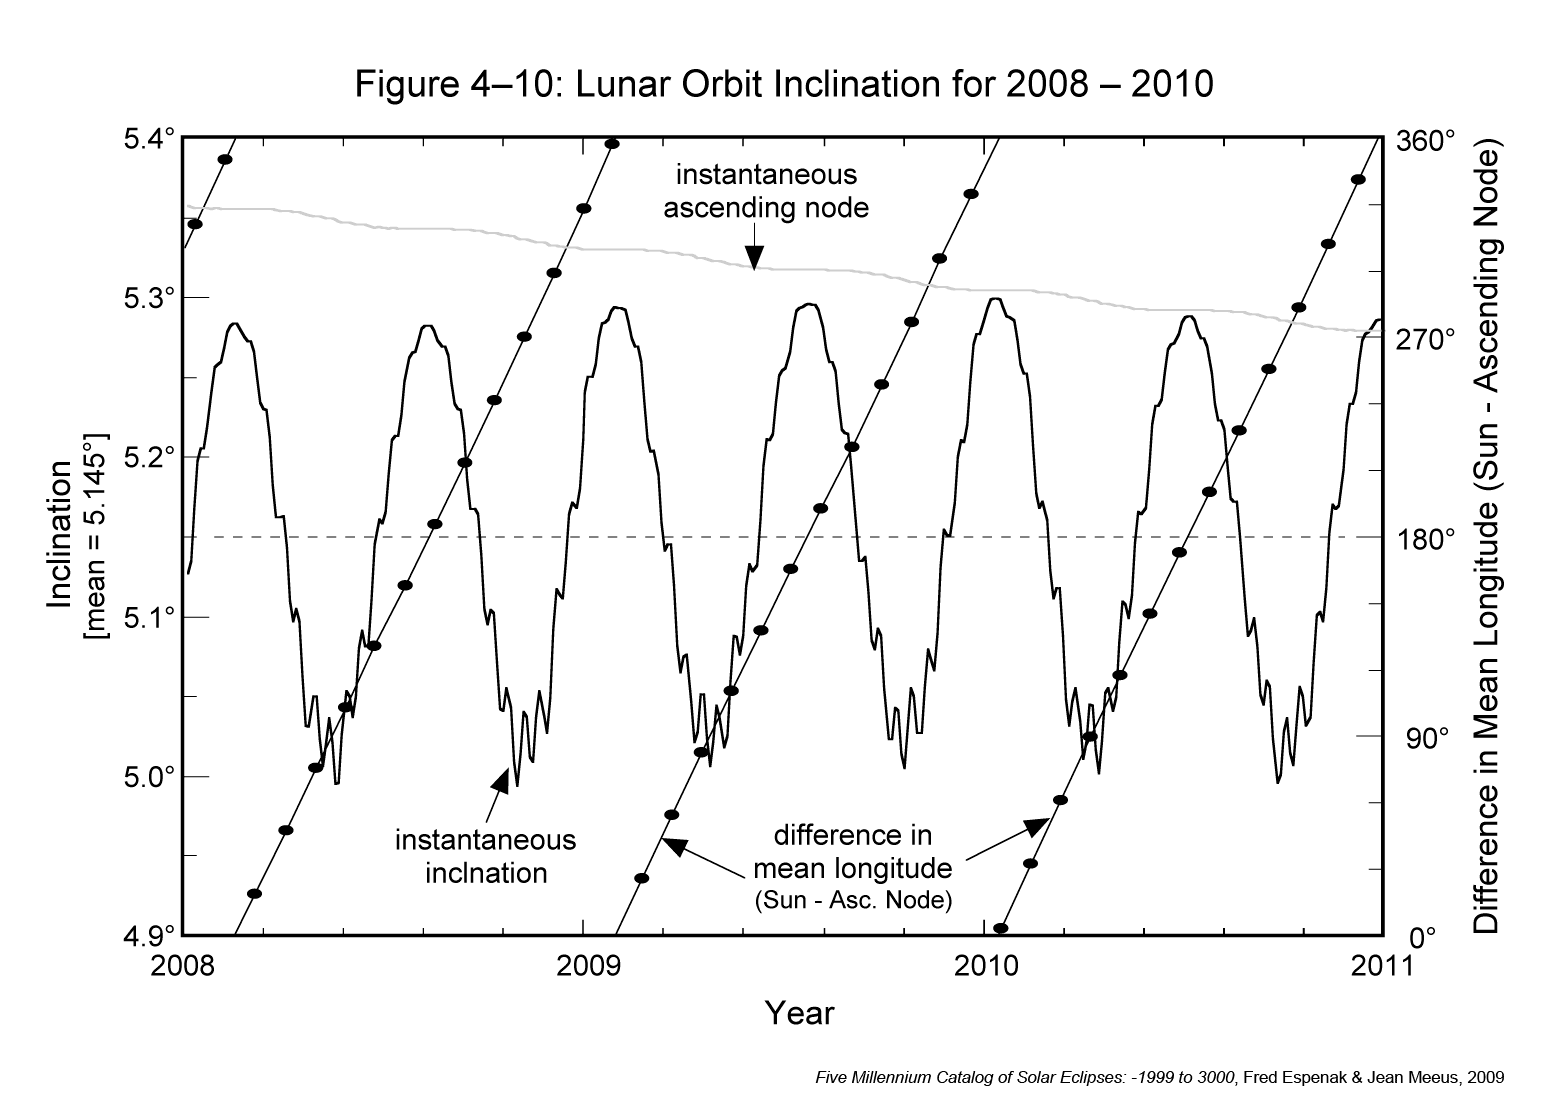
Figure 4-10 plots the instantaneous inclination of the lunar orbit over the 3-year period 2008-2010. The mean angle between the Sun and the ascending node (i.e., difference in mean longitude) is also plotted. The largest inclination of 5.30° occurs when the difference in longitude is either 0° or 180°. In other words, the inclination is always near its maximum value for both solar and lunar eclipses. The smallest inclination of 5.00° occurs when the difference in longitude is either 90° or 270°. Note the small monthly oscillations in the inclination when near its minimum. The figure also plots the longitude of the instantaneous ascending node. Its westward motion draws to a near standstill whenever the Sun aligns with either of the nodes. This corresponds to a difference in longitude of either 0° or 180°.
The mean interval in the periodic variation of both the draconic month and the orbital inclination is 173.3 days. This is the average time it takes for the Sun to travel from one node to the other. It is also equivalent to the interval between the midpoints of two eclipse seasons. The period is slightly less than half a year because of the retrograde motion of the nodes.
The length of the draconic month is strongly modulated by the position of the nodes with respect to the major axis of the Moon's orbit. The histogram in Figure 4-11 shows how the draconic month changes from 2008 through 2017. The 173-day alignment of the Sun with a node appears as the rapid oscillation in the month length. The quasi-sinusoidal envelopes surrounding the minima and maxima form two longer period oscillations. Over the 10-year period covered in this figure, the minimum month duration varies from 27.089 to 27.011 days (3.0 to 4.8 hours shorter than the mean). The maximum month duration ranges from 27.261 to 27.472 days (1.2 to 6.2 hours longer than the mean).

The difference in the mean longitudes of perigee and the ascending node appear as diagonal lines in Figure 4-11. This is the angle between these orbital parameters measured along the ecliptic. The greatest extremes in the draconic month occur when the angle between perigee and the ascending node is 0°. Likewise, the smallest extremes of the month take place when the difference in longitude is 180°. The mean rates of the major axis and the ascending node are 0.11140° east and 0.05295° west per day, respectively. Therefore, the mean period between alignments of the axis and node is 2190.4 days or 6.0 years. This period is clearly seen in Figure 4-11.
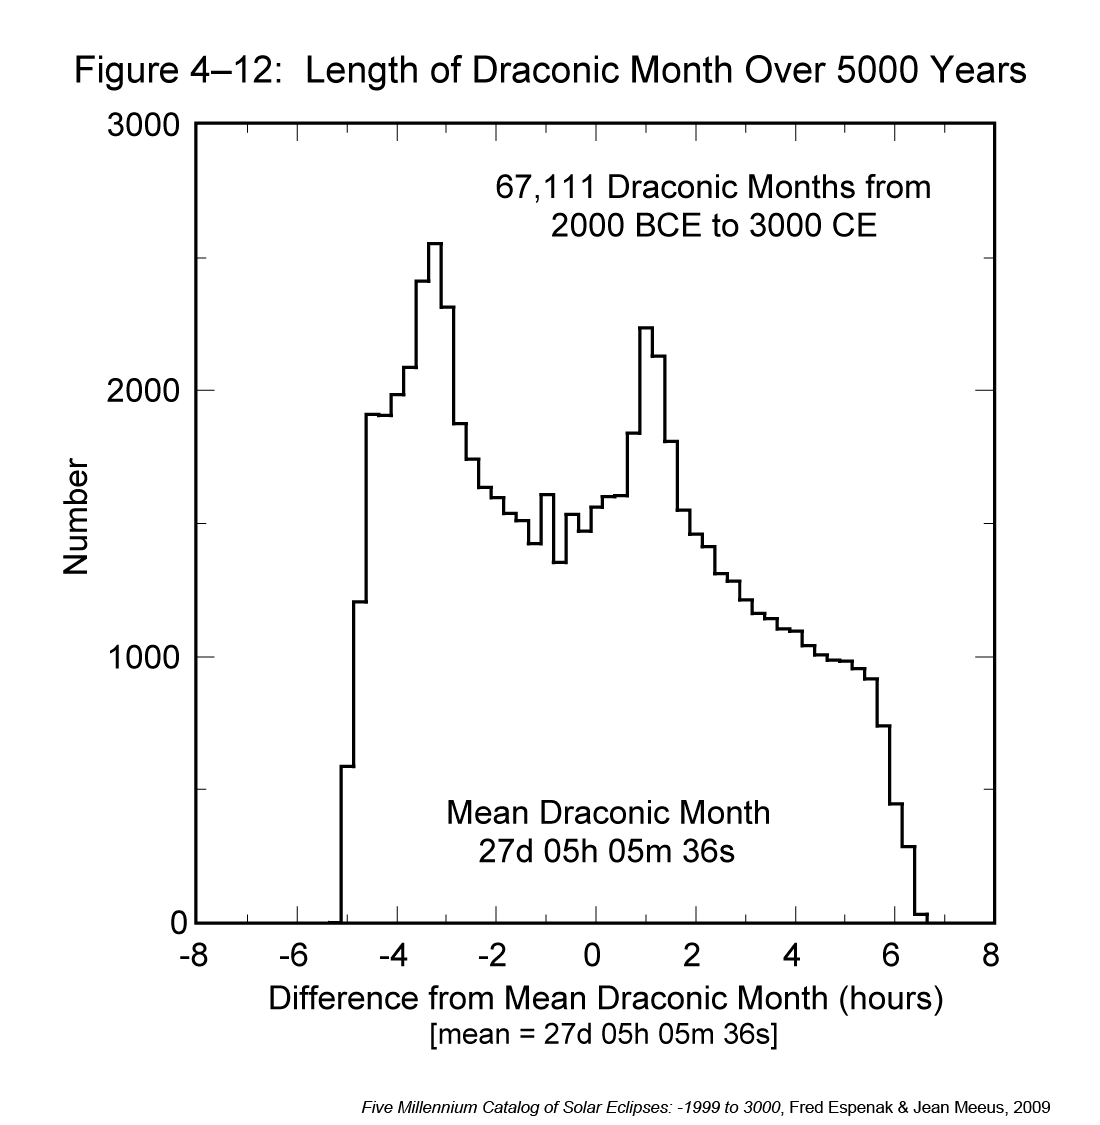
There are 67,111 draconic months during the 5000 years covered in this catalog. The shortest and longest months are 27.004 days (0.208 days or 5.0 hours shorter than the mean) and 27.487 days (0.275 days or 6.6 hours longer than the mean), respectively. A histogram of the distribution in the length of the draconic month over the five millennia appears in Figure 4-12 where the duration of individual draconic months have been binned into 30-min groups. The width and bifurcated symmetry of the distribution resemble the distribution for the lunation (synodic month) in Figure 4-4.
4.5 Eclipse Cycles
The interaction and harmonics of the synodic, anomalistic, and draconic months not only determine how frequently eclipses occur, but they also control the geometric characteristics and classification of each eclipse. The commensurability of these periods over long time scales results in several important eclipse cycles, which are discussed in Periodicity of Solar Eclipses and Periodicity of Lunar Eclipses.
References
Espenak, F., and Meeus, J., Five Millennium Canon of Solar Eclipses: -1999 to +3000 (2000 BCE to 3000 CE), NASA Tech. Pub. 2006-214141, NASA Goddard Space Flight Center, Greenbelt, Maryland (2006).
Espenak, F., and Meeus, J., Five Millennium Catalog of Solar Eclipses: -1999 to +3000 (2000 BCE to 3000 CE), NASA Tech. Pub. 2009-214174, NASA Goddard Space Flight Center, Greenbelt, Maryland (2009).
Espenak, F., and Meeus, J., Five Millennium Canon of Lunar Eclipses: -1999 to +3000 (2000 BCE to 3000 CE), NASA Tech. Pub. 2009-214172, NASA Goddard Space Flight Center, Greenbelt, Maryland (2009).
Espenak, F., and Meeus, J., Five Millennium Catalog of Lunar Eclipses: -1999 to +3000 (2000 BCE to 3000 CE), NASA Tech. Pub. 2008-214173, NASA Goddard Space Flight Center, Greenbelt, Maryland (2009).
Gingerich, O., (Translator), Canon of Eclipses, Dover Publications, New York (1962) (from the original T.R. von Oppolzer, book, Canon der Finsternisse, Wien, [1887]).
Meeus, J., Mathematical Astronomy Morsels III, Willmann-Bell, pp. 109-111, (2004).
Meeus, J., Grosjean, C.C., and Vanderleen, W., Canon of Solar Eclipses, Pergamon Press, Oxford, United Kingdom (1966).
van den Bergh, G., Periodicity and Variation of Solar (and Lunar) Eclipses, Tjeenk Willink, and Haarlem, Netherlands (1955).
von Oppolzer, T.R., Canon der Finsternisse, Wien, (1887).
Links to Eclipse Predictions
- Six Millennium Catalog of Solar Eclipses (web version)
- Catalog of Solar Eclipse Saros Series
- Periodicity of Solar Eclipses
- Five Millennium Catalog of Lunar Eclipses (web version)
- Catalog of Lunar Eclipse Saros Series
- Periodicity of Lunar Eclipses
Links to Additional Eclipse Predictions
- Home - home page of EclipseWise with predictions for both solar and lunar eclipses
- Solar Eclipses - primary page for solar eclipse predictions
- Solar Eclipse Links - detailed directory of links
- Lunar Eclipses - primary page for lunar eclipse predictions
- Lunar Eclipse Links - detailed directory of links
- MrEclipse.com - eclipse resources and tips on photography
- Solar Eclipses for Beginners - a primer on solar eclipse basics
- Lunar Eclipses for Beginners - a primer on lunar eclipse basics
Acknowledgments
The information presented on this web page is based on material originally published in:
Five Millennium Canon of Solar Eclipses: -1999 to +3000
Five Millennium Catalog of Solar Eclipses: -1999 to +3000
Five Millennium Canon of Lunar Eclipses: -1999 to +3000
Five Millennium Catalog of Lunar Eclipses: -1999 to +3000
For permission to reproduce this data or figures, please contact Fred Espenak. Any reproduction must be accompanied by an acknowledgment:
"Eclipse Predictions by Fred Espenak, www.EclipseWise.com"